Yakama vs Immigrants from Zaire 10th Grade
COMPARE
Yakama
Immigrants from Zaire
10th Grade
10th Grade Comparison
Yakama
Immigrants from Zaire
86.9%
10TH GRADE
0.0/ 100
METRIC RATING
343rd/ 347
METRIC RANK
93.4%
10TH GRADE
16.7/ 100
METRIC RATING
212th/ 347
METRIC RANK
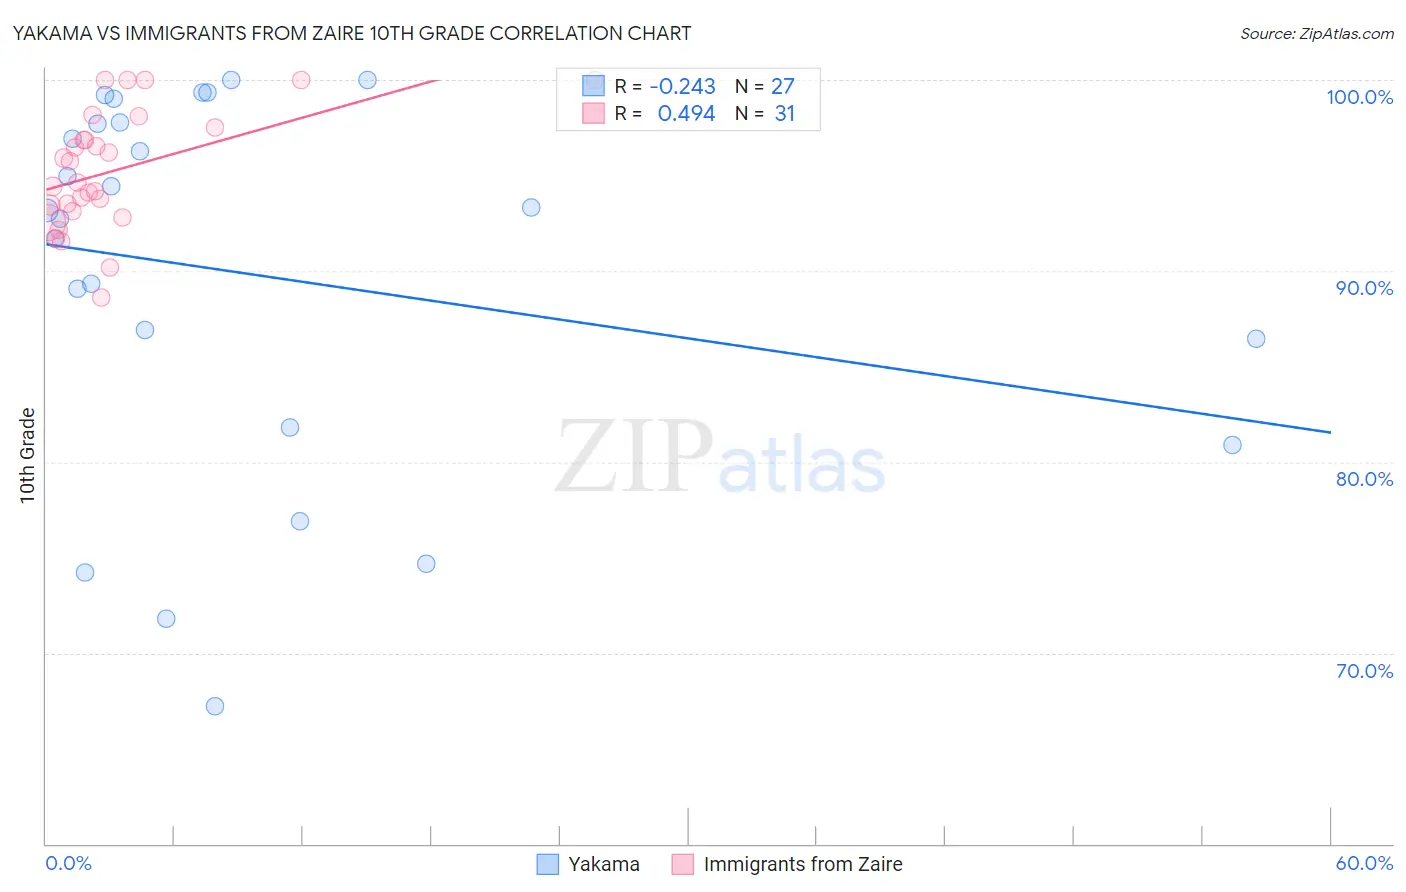
Yakama vs Immigrants from Zaire 10th Grade Correlation Chart
The statistical analysis conducted on geographies consisting of 19,923,144 people shows a weak negative correlation between the proportion of Yakama and percentage of population with at least 10th grade education in the United States with a correlation coefficient (R) of -0.243 and weighted average of 86.9%. Similarly, the statistical analysis conducted on geographies consisting of 107,212,695 people shows a moderate positive correlation between the proportion of Immigrants from Zaire and percentage of population with at least 10th grade education in the United States with a correlation coefficient (R) of 0.494 and weighted average of 93.4%, a difference of 7.5%.
10th Grade Correlation Summary
| Measurement | Yakama | Immigrants from Zaire |
| Minimum | 67.2% | 88.6% |
| Maximum | 100.0% | 100.0% |
| Range | 32.8% | 11.4% |
| Mean | 89.8% | 95.3% |
| Median | 93.2% | 94.6% |
| Interquartile 25% (IQ1) | 81.8% | 93.1% |
| Interquartile 75% (IQ3) | 97.8% | 97.5% |
| Interquartile Range (IQR) | 16.0% | 4.4% |
| Standard Deviation (Sample) | 9.8% | 3.1% |
| Standard Deviation (Population) | 9.6% | 3.0% |
Similar Demographics by 10th Grade
Demographics Similar to Yakama by 10th Grade
In terms of 10th grade, the demographic groups most similar to Yakama are Immigrants from El Salvador (86.8%, a difference of 0.14%), Immigrants from Central America (86.6%, a difference of 0.32%), Immigrants from Guatemala (87.4%, a difference of 0.58%), Salvadoran (87.5%, a difference of 0.74%), and Spanish American Indian (86.2%, a difference of 0.77%).
| Demographics | Rating | Rank | 10th Grade |
| Hondurans | 0.0 /100 | #333 | Tragic 89.0% |
| Hispanics or Latinos | 0.0 /100 | #334 | Tragic 88.9% |
| Immigrants | Dominican Republic | 0.0 /100 | #335 | Tragic 88.7% |
| Immigrants | Honduras | 0.0 /100 | #336 | Tragic 88.5% |
| Central Americans | 0.0 /100 | #337 | Tragic 88.4% |
| Immigrants | Latin America | 0.0 /100 | #338 | Tragic 88.3% |
| Guatemalans | 0.0 /100 | #339 | Tragic 87.9% |
| Mexicans | 0.0 /100 | #340 | Tragic 87.8% |
| Salvadorans | 0.0 /100 | #341 | Tragic 87.5% |
| Immigrants | Guatemala | 0.0 /100 | #342 | Tragic 87.4% |
| Yakama | 0.0 /100 | #343 | Tragic 86.9% |
| Immigrants | El Salvador | 0.0 /100 | #344 | Tragic 86.8% |
| Immigrants | Central America | 0.0 /100 | #345 | Tragic 86.6% |
| Spanish American Indians | 0.0 /100 | #346 | Tragic 86.2% |
| Immigrants | Mexico | 0.0 /100 | #347 | Tragic 86.2% |
Demographics Similar to Immigrants from Zaire by 10th Grade
In terms of 10th grade, the demographic groups most similar to Immigrants from Zaire are Cajun (93.4%, a difference of 0.0%), Indian (Asian) (93.4%, a difference of 0.010%), Immigrants from Asia (93.4%, a difference of 0.020%), Immigrants from Bahamas (93.4%, a difference of 0.020%), and Immigrants from Chile (93.4%, a difference of 0.030%).
| Demographics | Rating | Rank | 10th Grade |
| Immigrants | Indonesia | 20.2 /100 | #205 | Fair 93.4% |
| Immigrants | Sudan | 20.0 /100 | #206 | Fair 93.4% |
| Samoans | 19.5 /100 | #207 | Poor 93.4% |
| Immigrants | Syria | 19.4 /100 | #208 | Poor 93.4% |
| Immigrants | Chile | 18.8 /100 | #209 | Poor 93.4% |
| Indians (Asian) | 17.6 /100 | #210 | Poor 93.4% |
| Cajuns | 16.9 /100 | #211 | Poor 93.4% |
| Immigrants | Zaire | 16.7 /100 | #212 | Poor 93.4% |
| Immigrants | Asia | 15.7 /100 | #213 | Poor 93.4% |
| Immigrants | Bahamas | 15.2 /100 | #214 | Poor 93.4% |
| Immigrants | Oceania | 15.1 /100 | #215 | Poor 93.4% |
| Immigrants | Eastern Africa | 14.7 /100 | #216 | Poor 93.4% |
| Portuguese | 12.1 /100 | #217 | Poor 93.3% |
| Immigrants | Liberia | 10.2 /100 | #218 | Poor 93.3% |
| Seminole | 10.2 /100 | #219 | Poor 93.3% |