Immigrants from Micronesia vs Immigrants from Zaire 10th Grade
COMPARE
Immigrants from Micronesia
Immigrants from Zaire
10th Grade
10th Grade Comparison
Immigrants from Micronesia
Immigrants from Zaire
93.5%
10TH GRADE
23.2/ 100
METRIC RATING
198th/ 347
METRIC RANK
93.4%
10TH GRADE
16.7/ 100
METRIC RATING
212th/ 347
METRIC RANK
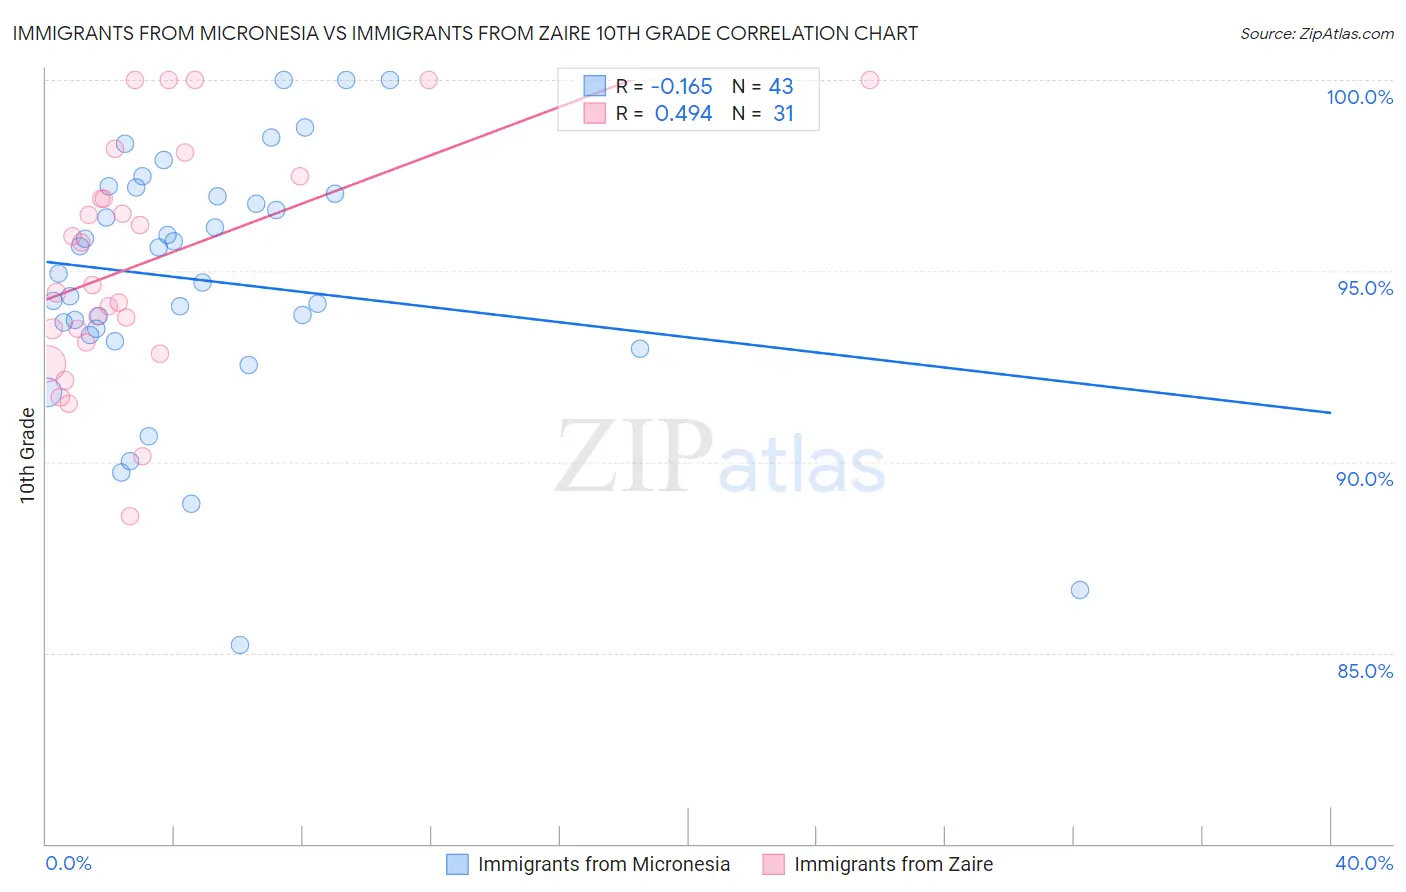
Immigrants from Micronesia vs Immigrants from Zaire 10th Grade Correlation Chart
The statistical analysis conducted on geographies consisting of 61,604,657 people shows a poor negative correlation between the proportion of Immigrants from Micronesia and percentage of population with at least 10th grade education in the United States with a correlation coefficient (R) of -0.165 and weighted average of 93.5%. Similarly, the statistical analysis conducted on geographies consisting of 107,212,695 people shows a moderate positive correlation between the proportion of Immigrants from Zaire and percentage of population with at least 10th grade education in the United States with a correlation coefficient (R) of 0.494 and weighted average of 93.4%, a difference of 0.090%.
10th Grade Correlation Summary
| Measurement | Immigrants from Micronesia | Immigrants from Zaire |
| Minimum | 85.2% | 88.6% |
| Maximum | 100.0% | 100.0% |
| Range | 14.8% | 11.4% |
| Mean | 94.7% | 95.3% |
| Median | 94.9% | 94.6% |
| Interquartile 25% (IQ1) | 93.3% | 93.1% |
| Interquartile 75% (IQ3) | 97.0% | 97.5% |
| Interquartile Range (IQR) | 3.7% | 4.4% |
| Standard Deviation (Sample) | 3.3% | 3.1% |
| Standard Deviation (Population) | 3.3% | 3.0% |
Demographics Similar to Immigrants from Micronesia and Immigrants from Zaire by 10th Grade
In terms of 10th grade, the demographic groups most similar to Immigrants from Micronesia are Asian (93.5%, a difference of 0.0%), Pueblo (93.5%, a difference of 0.010%), Hopi (93.5%, a difference of 0.010%), Hawaiian (93.5%, a difference of 0.020%), and Moroccan (93.5%, a difference of 0.030%). Similarly, the demographic groups most similar to Immigrants from Zaire are Cajun (93.4%, a difference of 0.0%), Indian (Asian) (93.4%, a difference of 0.010%), Immigrants from Asia (93.4%, a difference of 0.020%), Immigrants from Bahamas (93.4%, a difference of 0.020%), and Immigrants from Chile (93.4%, a difference of 0.030%).
| Demographics | Rating | Rank | 10th Grade |
| Cheyenne | 26.8 /100 | #195 | Fair 93.5% |
| Moroccans | 25.3 /100 | #196 | Fair 93.5% |
| Pueblo | 23.9 /100 | #197 | Fair 93.5% |
| Immigrants | Micronesia | 23.2 /100 | #198 | Fair 93.5% |
| Asians | 23.0 /100 | #199 | Fair 93.5% |
| Hopi | 22.2 /100 | #200 | Fair 93.5% |
| Hawaiians | 21.8 /100 | #201 | Fair 93.5% |
| Immigrants | Uganda | 20.9 /100 | #202 | Fair 93.5% |
| Immigrants | Western Asia | 20.6 /100 | #203 | Fair 93.4% |
| Ute | 20.3 /100 | #204 | Fair 93.4% |
| Immigrants | Indonesia | 20.2 /100 | #205 | Fair 93.4% |
| Immigrants | Sudan | 20.0 /100 | #206 | Fair 93.4% |
| Samoans | 19.5 /100 | #207 | Poor 93.4% |
| Immigrants | Syria | 19.4 /100 | #208 | Poor 93.4% |
| Immigrants | Chile | 18.8 /100 | #209 | Poor 93.4% |
| Indians (Asian) | 17.6 /100 | #210 | Poor 93.4% |
| Cajuns | 16.9 /100 | #211 | Poor 93.4% |
| Immigrants | Zaire | 16.7 /100 | #212 | Poor 93.4% |
| Immigrants | Asia | 15.7 /100 | #213 | Poor 93.4% |
| Immigrants | Bahamas | 15.2 /100 | #214 | Poor 93.4% |
| Immigrants | Oceania | 15.1 /100 | #215 | Poor 93.4% |