Peruvian vs Immigrants from Cambodia 10th Grade
COMPARE
Peruvian
Immigrants from Cambodia
10th Grade
10th Grade Comparison
Peruvians
Immigrants from Cambodia
92.6%
10TH GRADE
0.4/ 100
METRIC RATING
264th/ 347
METRIC RANK
90.9%
10TH GRADE
0.0/ 100
METRIC RATING
311th/ 347
METRIC RANK
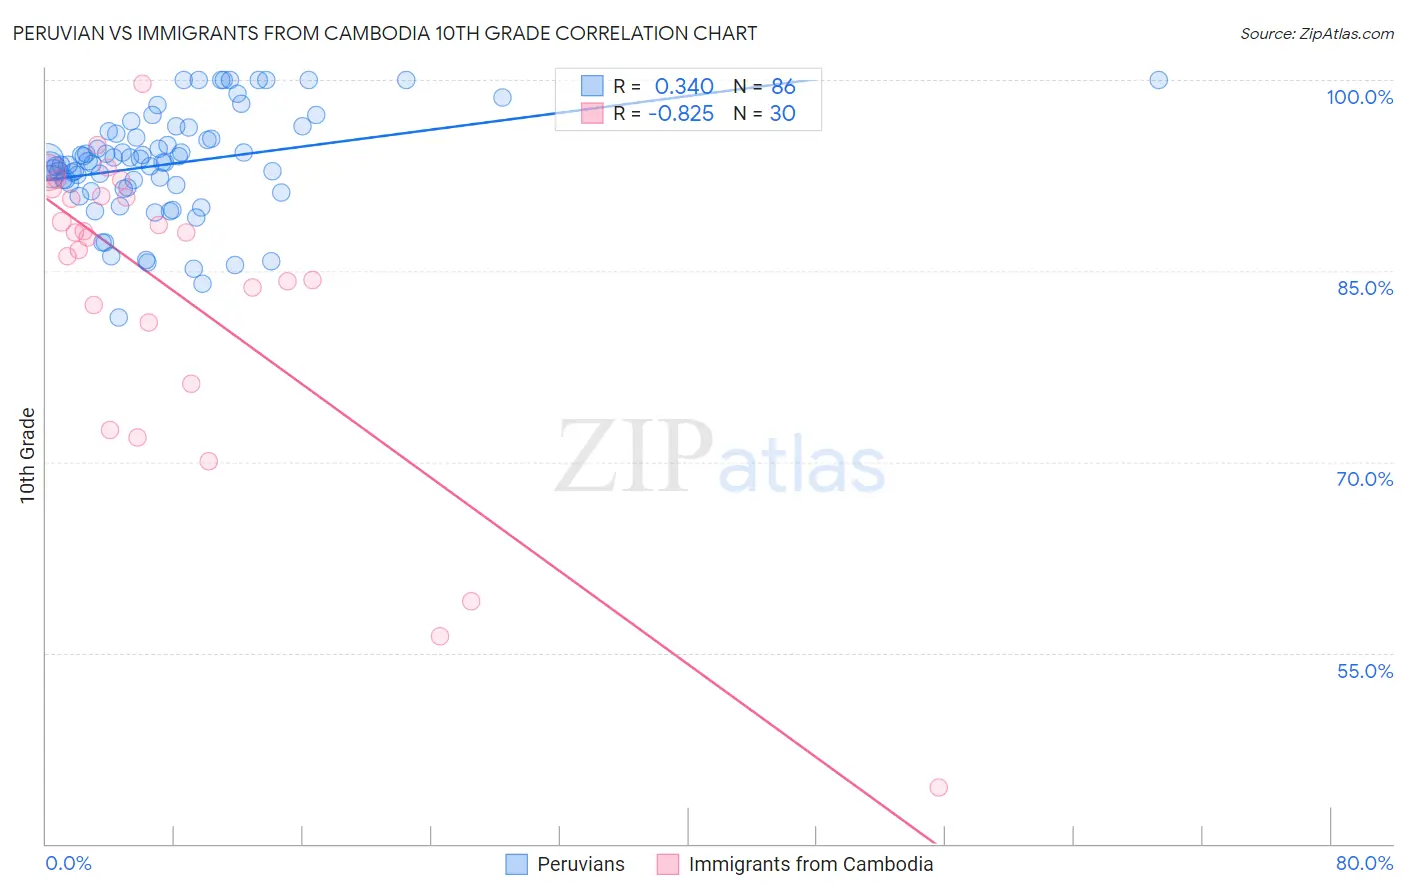
Peruvian vs Immigrants from Cambodia 10th Grade Correlation Chart
The statistical analysis conducted on geographies consisting of 363,251,075 people shows a mild positive correlation between the proportion of Peruvians and percentage of population with at least 10th grade education in the United States with a correlation coefficient (R) of 0.340 and weighted average of 92.6%. Similarly, the statistical analysis conducted on geographies consisting of 205,153,442 people shows a very strong negative correlation between the proportion of Immigrants from Cambodia and percentage of population with at least 10th grade education in the United States with a correlation coefficient (R) of -0.825 and weighted average of 90.9%, a difference of 1.8%.
10th Grade Correlation Summary
| Measurement | Peruvian | Immigrants from Cambodia |
| Minimum | 81.4% | 44.4% |
| Maximum | 100.0% | 99.7% |
| Range | 18.6% | 55.2% |
| Mean | 93.4% | 83.2% |
| Median | 93.5% | 87.8% |
| Interquartile 25% (IQ1) | 91.6% | 80.9% |
| Interquartile 75% (IQ3) | 95.8% | 90.8% |
| Interquartile Range (IQR) | 4.2% | 9.9% |
| Standard Deviation (Sample) | 4.1% | 12.4% |
| Standard Deviation (Population) | 4.1% | 12.2% |
Similar Demographics by 10th Grade
Demographics Similar to Peruvians by 10th Grade
In terms of 10th grade, the demographic groups most similar to Peruvians are Immigrants from South America (92.6%, a difference of 0.0%), Apache (92.6%, a difference of 0.0%), Paiute (92.6%, a difference of 0.010%), Dutch West Indian (92.6%, a difference of 0.030%), and Immigrants from Philippines (92.6%, a difference of 0.030%).
| Demographics | Rating | Rank | 10th Grade |
| U.S. Virgin Islanders | 0.7 /100 | #257 | Tragic 92.7% |
| Immigrants | Costa Rica | 0.6 /100 | #258 | Tragic 92.7% |
| Immigrants | Jamaica | 0.5 /100 | #259 | Tragic 92.6% |
| Immigrants | Uzbekistan | 0.5 /100 | #260 | Tragic 92.6% |
| Paiute | 0.4 /100 | #261 | Tragic 92.6% |
| Immigrants | South America | 0.4 /100 | #262 | Tragic 92.6% |
| Apache | 0.4 /100 | #263 | Tragic 92.6% |
| Peruvians | 0.4 /100 | #264 | Tragic 92.6% |
| Dutch West Indians | 0.4 /100 | #265 | Tragic 92.6% |
| Immigrants | Philippines | 0.4 /100 | #266 | Tragic 92.6% |
| Taiwanese | 0.3 /100 | #267 | Tragic 92.5% |
| Immigrants | Ghana | 0.3 /100 | #268 | Tragic 92.5% |
| Immigrants | Colombia | 0.3 /100 | #269 | Tragic 92.5% |
| Immigrants | Uruguay | 0.3 /100 | #270 | Tragic 92.5% |
| Immigrants | Eritrea | 0.3 /100 | #271 | Tragic 92.5% |
Demographics Similar to Immigrants from Cambodia by 10th Grade
In terms of 10th grade, the demographic groups most similar to Immigrants from Cambodia are Vietnamese (90.9%, a difference of 0.020%), Immigrants (91.0%, a difference of 0.060%), Immigrants from Bangladesh (91.0%, a difference of 0.10%), Immigrants from Fiji (91.0%, a difference of 0.11%), and Immigrants from Portugal (90.8%, a difference of 0.16%).
| Demographics | Rating | Rank | 10th Grade |
| Pima | 0.0 /100 | #304 | Tragic 91.2% |
| Immigrants | Dominica | 0.0 /100 | #305 | Tragic 91.1% |
| Yaqui | 0.0 /100 | #306 | Tragic 91.1% |
| Immigrants | Fiji | 0.0 /100 | #307 | Tragic 91.0% |
| Immigrants | Bangladesh | 0.0 /100 | #308 | Tragic 91.0% |
| Immigrants | Immigrants | 0.0 /100 | #309 | Tragic 91.0% |
| Vietnamese | 0.0 /100 | #310 | Tragic 90.9% |
| Immigrants | Cambodia | 0.0 /100 | #311 | Tragic 90.9% |
| Immigrants | Portugal | 0.0 /100 | #312 | Tragic 90.8% |
| Cape Verdeans | 0.0 /100 | #313 | Tragic 90.8% |
| Nepalese | 0.0 /100 | #314 | Tragic 90.7% |
| Immigrants | Caribbean | 0.0 /100 | #315 | Tragic 90.6% |
| Ecuadorians | 0.0 /100 | #316 | Tragic 90.6% |
| Immigrants | Ecuador | 0.0 /100 | #317 | Tragic 90.4% |
| Immigrants | Cuba | 0.0 /100 | #318 | Tragic 90.2% |