Peruvian vs Immigrants from Kuwait 9th Grade
COMPARE
Peruvian
Immigrants from Kuwait
9th Grade
9th Grade Comparison
Peruvians
Immigrants from Kuwait
93.8%
9TH GRADE
0.2/ 100
METRIC RATING
274th/ 347
METRIC RANK
95.4%
9TH GRADE
95.5/ 100
METRIC RATING
122nd/ 347
METRIC RANK
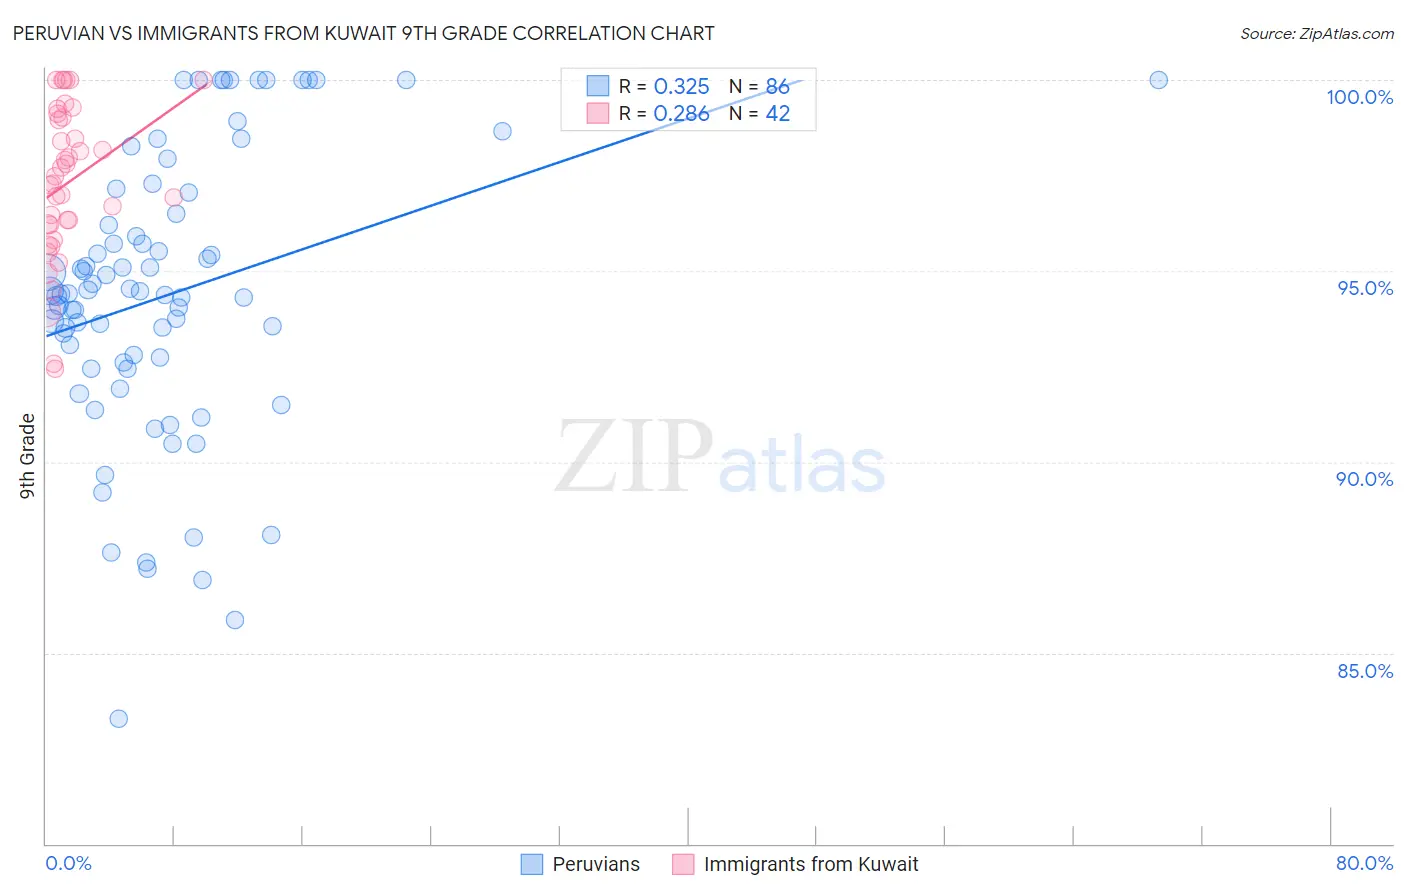
Peruvian vs Immigrants from Kuwait 9th Grade Correlation Chart
The statistical analysis conducted on geographies consisting of 363,251,075 people shows a mild positive correlation between the proportion of Peruvians and percentage of population with at least 9th grade education in the United States with a correlation coefficient (R) of 0.325 and weighted average of 93.8%. Similarly, the statistical analysis conducted on geographies consisting of 136,913,666 people shows a weak positive correlation between the proportion of Immigrants from Kuwait and percentage of population with at least 9th grade education in the United States with a correlation coefficient (R) of 0.286 and weighted average of 95.4%, a difference of 1.8%.
9th Grade Correlation Summary
| Measurement | Peruvian | Immigrants from Kuwait |
| Minimum | 83.3% | 92.5% |
| Maximum | 100.0% | 100.0% |
| Range | 16.7% | 7.5% |
| Mean | 94.4% | 97.3% |
| Median | 94.4% | 97.4% |
| Interquartile 25% (IQ1) | 92.6% | 96.2% |
| Interquartile 75% (IQ3) | 96.5% | 99.0% |
| Interquartile Range (IQR) | 3.9% | 2.8% |
| Standard Deviation (Sample) | 3.7% | 2.0% |
| Standard Deviation (Population) | 3.7% | 2.0% |
Similar Demographics by 9th Grade
Demographics Similar to Peruvians by 9th Grade
In terms of 9th grade, the demographic groups most similar to Peruvians are Immigrants from South America (93.8%, a difference of 0.0%), Immigrants from Western Africa (93.8%, a difference of 0.010%), Immigrants from Colombia (93.8%, a difference of 0.010%), Immigrants from Ghana (93.8%, a difference of 0.020%), and West Indian (93.7%, a difference of 0.030%).
| Demographics | Rating | Rank | 9th Grade |
| Armenians | 0.3 /100 | #267 | Tragic 93.9% |
| Immigrants | Bolivia | 0.3 /100 | #268 | Tragic 93.9% |
| Immigrants | Uruguay | 0.2 /100 | #269 | Tragic 93.8% |
| Yuman | 0.2 /100 | #270 | Tragic 93.8% |
| Immigrants | Ghana | 0.2 /100 | #271 | Tragic 93.8% |
| Immigrants | Western Africa | 0.2 /100 | #272 | Tragic 93.8% |
| Immigrants | South America | 0.2 /100 | #273 | Tragic 93.8% |
| Peruvians | 0.2 /100 | #274 | Tragic 93.8% |
| Immigrants | Colombia | 0.2 /100 | #275 | Tragic 93.8% |
| West Indians | 0.2 /100 | #276 | Tragic 93.7% |
| Immigrants | Philippines | 0.1 /100 | #277 | Tragic 93.7% |
| Immigrants | Eritrea | 0.1 /100 | #278 | Tragic 93.7% |
| Trinidadians and Tobagonians | 0.1 /100 | #279 | Tragic 93.7% |
| Taiwanese | 0.1 /100 | #280 | Tragic 93.6% |
| Immigrants | Trinidad and Tobago | 0.1 /100 | #281 | Tragic 93.6% |
Demographics Similar to Immigrants from Kuwait by 9th Grade
In terms of 9th grade, the demographic groups most similar to Immigrants from Kuwait are Immigrants from Romania (95.4%, a difference of 0.0%), Immigrants from Turkey (95.4%, a difference of 0.0%), Soviet Union (95.4%, a difference of 0.0%), Cambodian (95.4%, a difference of 0.0%), and Cree (95.4%, a difference of 0.0%).
| Demographics | Rating | Rank | 9th Grade |
| Burmese | 96.0 /100 | #115 | Exceptional 95.4% |
| Immigrants | Europe | 95.7 /100 | #116 | Exceptional 95.4% |
| Immigrants | Romania | 95.6 /100 | #117 | Exceptional 95.4% |
| Immigrants | Turkey | 95.6 /100 | #118 | Exceptional 95.4% |
| Soviet Union | 95.6 /100 | #119 | Exceptional 95.4% |
| Cambodians | 95.6 /100 | #120 | Exceptional 95.4% |
| Cree | 95.5 /100 | #121 | Exceptional 95.4% |
| Immigrants | Kuwait | 95.5 /100 | #122 | Exceptional 95.4% |
| Kiowa | 95.3 /100 | #123 | Exceptional 95.4% |
| Shoshone | 95.3 /100 | #124 | Exceptional 95.4% |
| Immigrants | South Central Asia | 95.1 /100 | #125 | Exceptional 95.4% |
| Immigrants | Serbia | 94.4 /100 | #126 | Exceptional 95.4% |
| Palestinians | 94.3 /100 | #127 | Exceptional 95.4% |
| Immigrants | Hungary | 94.2 /100 | #128 | Exceptional 95.4% |
| Basques | 94.1 /100 | #129 | Exceptional 95.4% |