Belizean vs Immigrants from Micronesia 9th Grade
COMPARE
Belizean
Immigrants from Micronesia
9th Grade
9th Grade Comparison
Belizeans
Immigrants from Micronesia
91.8%
9TH GRADE
0.0/ 100
METRIC RATING
322nd/ 347
METRIC RANK
94.7%
9TH GRADE
24.7/ 100
METRIC RATING
197th/ 347
METRIC RANK
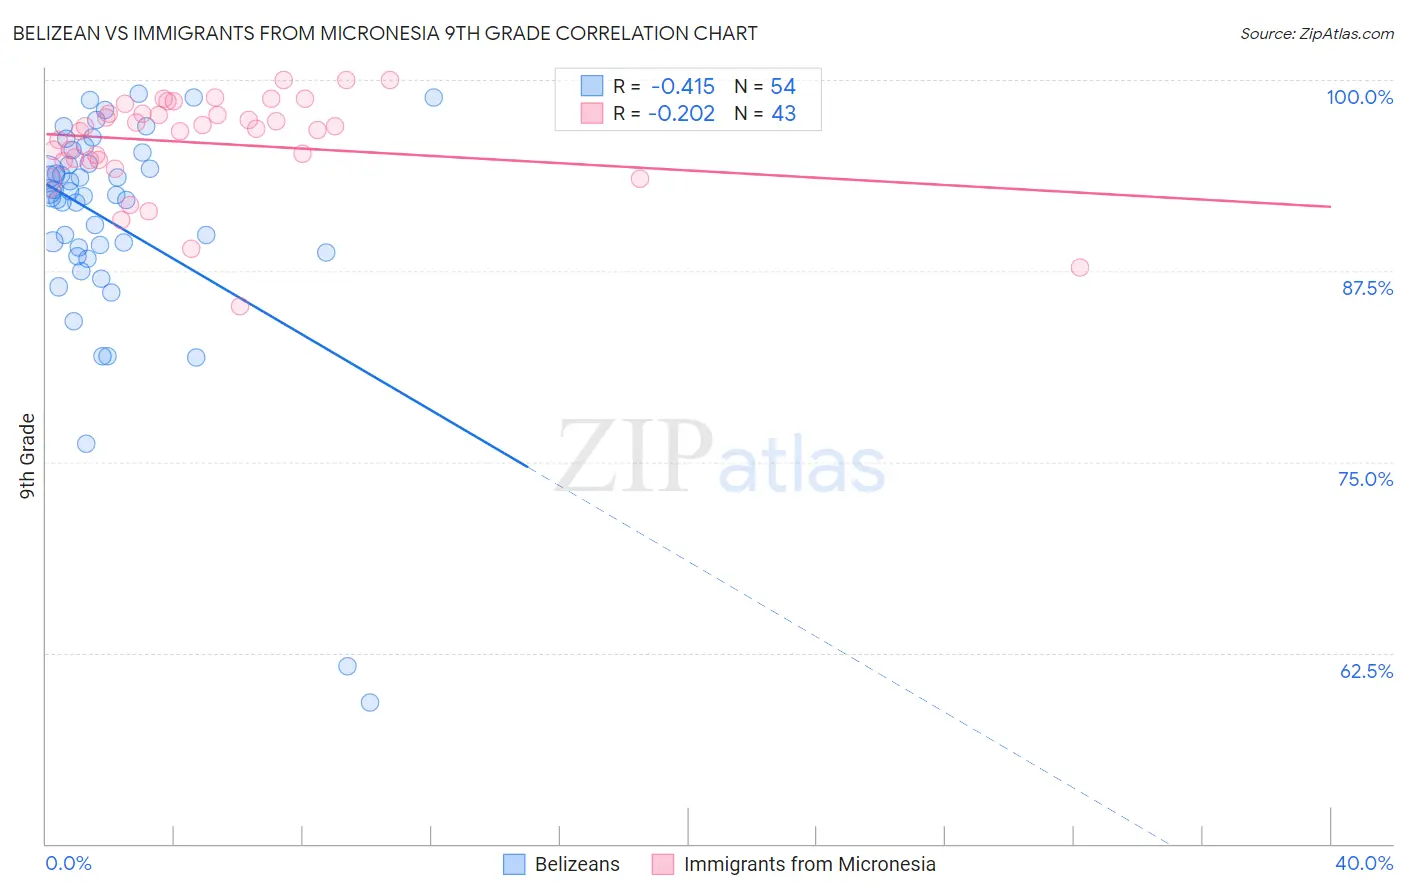
Belizean vs Immigrants from Micronesia 9th Grade Correlation Chart
The statistical analysis conducted on geographies consisting of 144,225,006 people shows a moderate negative correlation between the proportion of Belizeans and percentage of population with at least 9th grade education in the United States with a correlation coefficient (R) of -0.415 and weighted average of 91.8%. Similarly, the statistical analysis conducted on geographies consisting of 61,604,657 people shows a weak negative correlation between the proportion of Immigrants from Micronesia and percentage of population with at least 9th grade education in the United States with a correlation coefficient (R) of -0.202 and weighted average of 94.7%, a difference of 3.1%.
9th Grade Correlation Summary
| Measurement | Belizean | Immigrants from Micronesia |
| Minimum | 59.3% | 85.2% |
| Maximum | 99.1% | 100.0% |
| Range | 39.8% | 14.8% |
| Mean | 90.6% | 95.9% |
| Median | 92.4% | 96.8% |
| Interquartile 25% (IQ1) | 88.7% | 94.7% |
| Interquartile 75% (IQ3) | 94.5% | 97.8% |
| Interquartile Range (IQR) | 5.9% | 3.0% |
| Standard Deviation (Sample) | 7.7% | 3.3% |
| Standard Deviation (Population) | 7.6% | 3.2% |
Similar Demographics by 9th Grade
Demographics Similar to Belizeans by 9th Grade
In terms of 9th grade, the demographic groups most similar to Belizeans are Puerto Rican (91.8%, a difference of 0.0%), Immigrants from Ecuador (91.8%, a difference of 0.030%), Immigrants from Belize (91.8%, a difference of 0.060%), Nicaraguan (91.9%, a difference of 0.090%), and Ecuadorian (91.9%, a difference of 0.13%).
| Demographics | Rating | Rank | 9th Grade |
| Immigrants | Caribbean | 0.0 /100 | #315 | Tragic 92.2% |
| Cape Verdeans | 0.0 /100 | #316 | Tragic 92.2% |
| Immigrants | Cuba | 0.0 /100 | #317 | Tragic 92.2% |
| Nepalese | 0.0 /100 | #318 | Tragic 92.0% |
| Ecuadorians | 0.0 /100 | #319 | Tragic 91.9% |
| Nicaraguans | 0.0 /100 | #320 | Tragic 91.9% |
| Immigrants | Ecuador | 0.0 /100 | #321 | Tragic 91.8% |
| Belizeans | 0.0 /100 | #322 | Tragic 91.8% |
| Puerto Ricans | 0.0 /100 | #323 | Tragic 91.8% |
| Immigrants | Belize | 0.0 /100 | #324 | Tragic 91.8% |
| Central American Indians | 0.0 /100 | #325 | Tragic 91.5% |
| Immigrants | Armenia | 0.0 /100 | #326 | Tragic 91.4% |
| Immigrants | Nicaragua | 0.0 /100 | #327 | Tragic 91.3% |
| Dominicans | 0.0 /100 | #328 | Tragic 91.1% |
| Hondurans | 0.0 /100 | #329 | Tragic 91.0% |
Demographics Similar to Immigrants from Micronesia by 9th Grade
In terms of 9th grade, the demographic groups most similar to Immigrants from Micronesia are Immigrants from Lebanon (94.7%, a difference of 0.020%), Hawaiian (94.7%, a difference of 0.020%), Marshallese (94.7%, a difference of 0.030%), Panamanian (94.7%, a difference of 0.040%), and Laotian (94.6%, a difference of 0.040%).
| Demographics | Rating | Rank | 9th Grade |
| Sudanese | 32.7 /100 | #190 | Fair 94.7% |
| Assyrians/Chaldeans/Syriacs | 32.0 /100 | #191 | Fair 94.7% |
| Immigrants | Northern Africa | 30.7 /100 | #192 | Fair 94.7% |
| Paraguayans | 30.1 /100 | #193 | Fair 94.7% |
| Panamanians | 29.0 /100 | #194 | Fair 94.7% |
| Marshallese | 27.9 /100 | #195 | Fair 94.7% |
| Immigrants | Lebanon | 27.2 /100 | #196 | Fair 94.7% |
| Immigrants | Micronesia | 24.7 /100 | #197 | Fair 94.7% |
| Hawaiians | 22.7 /100 | #198 | Fair 94.7% |
| Laotians | 21.0 /100 | #199 | Fair 94.6% |
| Immigrants | Zaire | 20.6 /100 | #200 | Fair 94.6% |
| Blacks/African Americans | 20.5 /100 | #201 | Fair 94.6% |
| Immigrants | Eastern Asia | 19.8 /100 | #202 | Poor 94.6% |
| Immigrants | Bahamas | 19.8 /100 | #203 | Poor 94.6% |
| Moroccans | 19.6 /100 | #204 | Poor 94.6% |