Peruvian vs Immigrants from Australia 9th Grade
COMPARE
Peruvian
Immigrants from Australia
9th Grade
9th Grade Comparison
Peruvians
Immigrants from Australia
93.8%
9TH GRADE
0.2/ 100
METRIC RATING
274th/ 347
METRIC RANK
95.8%
9TH GRADE
99.5/ 100
METRIC RATING
70th/ 347
METRIC RANK
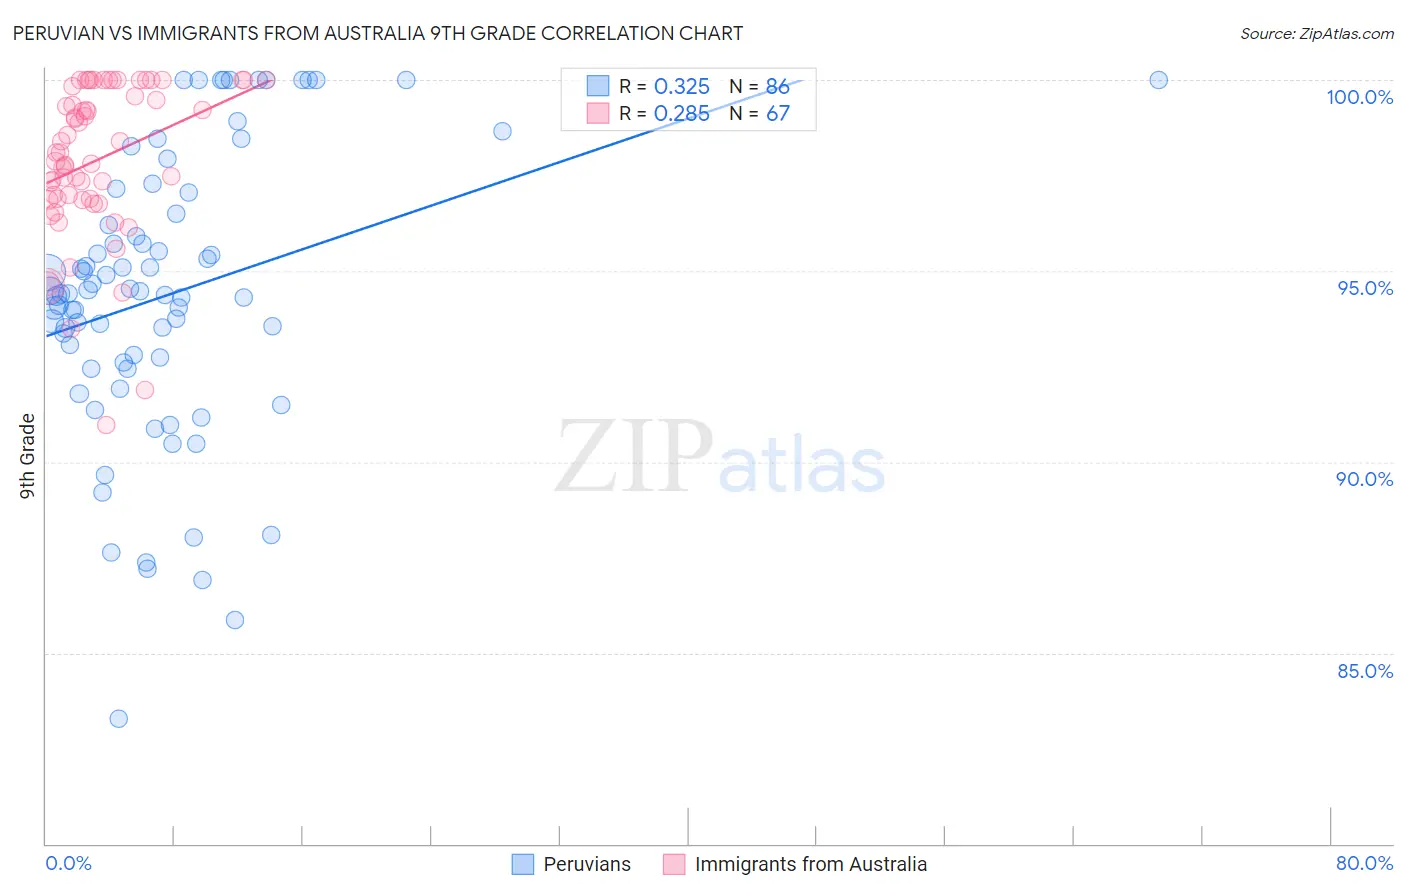
Peruvian vs Immigrants from Australia 9th Grade Correlation Chart
The statistical analysis conducted on geographies consisting of 363,251,075 people shows a mild positive correlation between the proportion of Peruvians and percentage of population with at least 9th grade education in the United States with a correlation coefficient (R) of 0.325 and weighted average of 93.8%. Similarly, the statistical analysis conducted on geographies consisting of 227,202,602 people shows a weak positive correlation between the proportion of Immigrants from Australia and percentage of population with at least 9th grade education in the United States with a correlation coefficient (R) of 0.285 and weighted average of 95.8%, a difference of 2.2%.
9th Grade Correlation Summary
| Measurement | Peruvian | Immigrants from Australia |
| Minimum | 83.3% | 91.0% |
| Maximum | 100.0% | 100.0% |
| Range | 16.7% | 9.0% |
| Mean | 94.4% | 97.9% |
| Median | 94.4% | 98.1% |
| Interquartile 25% (IQ1) | 92.6% | 96.9% |
| Interquartile 75% (IQ3) | 96.5% | 99.8% |
| Interquartile Range (IQR) | 3.9% | 3.0% |
| Standard Deviation (Sample) | 3.7% | 2.0% |
| Standard Deviation (Population) | 3.7% | 2.0% |
Similar Demographics by 9th Grade
Demographics Similar to Peruvians by 9th Grade
In terms of 9th grade, the demographic groups most similar to Peruvians are Immigrants from South America (93.8%, a difference of 0.0%), Immigrants from Western Africa (93.8%, a difference of 0.010%), Immigrants from Colombia (93.8%, a difference of 0.010%), Immigrants from Ghana (93.8%, a difference of 0.020%), and West Indian (93.7%, a difference of 0.030%).
| Demographics | Rating | Rank | 9th Grade |
| Armenians | 0.3 /100 | #267 | Tragic 93.9% |
| Immigrants | Bolivia | 0.3 /100 | #268 | Tragic 93.9% |
| Immigrants | Uruguay | 0.2 /100 | #269 | Tragic 93.8% |
| Yuman | 0.2 /100 | #270 | Tragic 93.8% |
| Immigrants | Ghana | 0.2 /100 | #271 | Tragic 93.8% |
| Immigrants | Western Africa | 0.2 /100 | #272 | Tragic 93.8% |
| Immigrants | South America | 0.2 /100 | #273 | Tragic 93.8% |
| Peruvians | 0.2 /100 | #274 | Tragic 93.8% |
| Immigrants | Colombia | 0.2 /100 | #275 | Tragic 93.8% |
| West Indians | 0.2 /100 | #276 | Tragic 93.7% |
| Immigrants | Philippines | 0.1 /100 | #277 | Tragic 93.7% |
| Immigrants | Eritrea | 0.1 /100 | #278 | Tragic 93.7% |
| Trinidadians and Tobagonians | 0.1 /100 | #279 | Tragic 93.7% |
| Taiwanese | 0.1 /100 | #280 | Tragic 93.6% |
| Immigrants | Trinidad and Tobago | 0.1 /100 | #281 | Tragic 93.6% |
Demographics Similar to Immigrants from Australia by 9th Grade
In terms of 9th grade, the demographic groups most similar to Immigrants from Australia are Immigrants from Belgium (95.8%, a difference of 0.010%), Turkish (95.8%, a difference of 0.010%), Immigrants from Singapore (95.8%, a difference of 0.010%), Thai (95.8%, a difference of 0.010%), and Cypriot (95.8%, a difference of 0.020%).
| Demographics | Rating | Rank | 9th Grade |
| Canadians | 99.7 /100 | #63 | Exceptional 95.9% |
| Zimbabweans | 99.7 /100 | #64 | Exceptional 95.9% |
| Immigrants | England | 99.6 /100 | #65 | Exceptional 95.9% |
| Immigrants | Netherlands | 99.6 /100 | #66 | Exceptional 95.8% |
| Cypriots | 99.6 /100 | #67 | Exceptional 95.8% |
| Immigrants | Ireland | 99.6 /100 | #68 | Exceptional 95.8% |
| Immigrants | Lithuania | 99.6 /100 | #69 | Exceptional 95.8% |
| Immigrants | Australia | 99.5 /100 | #70 | Exceptional 95.8% |
| Immigrants | Belgium | 99.5 /100 | #71 | Exceptional 95.8% |
| Turks | 99.5 /100 | #72 | Exceptional 95.8% |
| Immigrants | Singapore | 99.5 /100 | #73 | Exceptional 95.8% |
| Thais | 99.5 /100 | #74 | Exceptional 95.8% |
| Inupiat | 99.5 /100 | #75 | Exceptional 95.8% |
| Immigrants | Sweden | 99.5 /100 | #76 | Exceptional 95.8% |
| Whites/Caucasians | 99.4 /100 | #77 | Exceptional 95.8% |