Peruvian vs Immigrants from the Azores 9th Grade
COMPARE
Peruvian
Immigrants from the Azores
9th Grade
9th Grade Comparison
Peruvians
Immigrants from the Azores
93.8%
9TH GRADE
0.2/ 100
METRIC RATING
274th/ 347
METRIC RANK
90.8%
9TH GRADE
0.0/ 100
METRIC RATING
334th/ 347
METRIC RANK
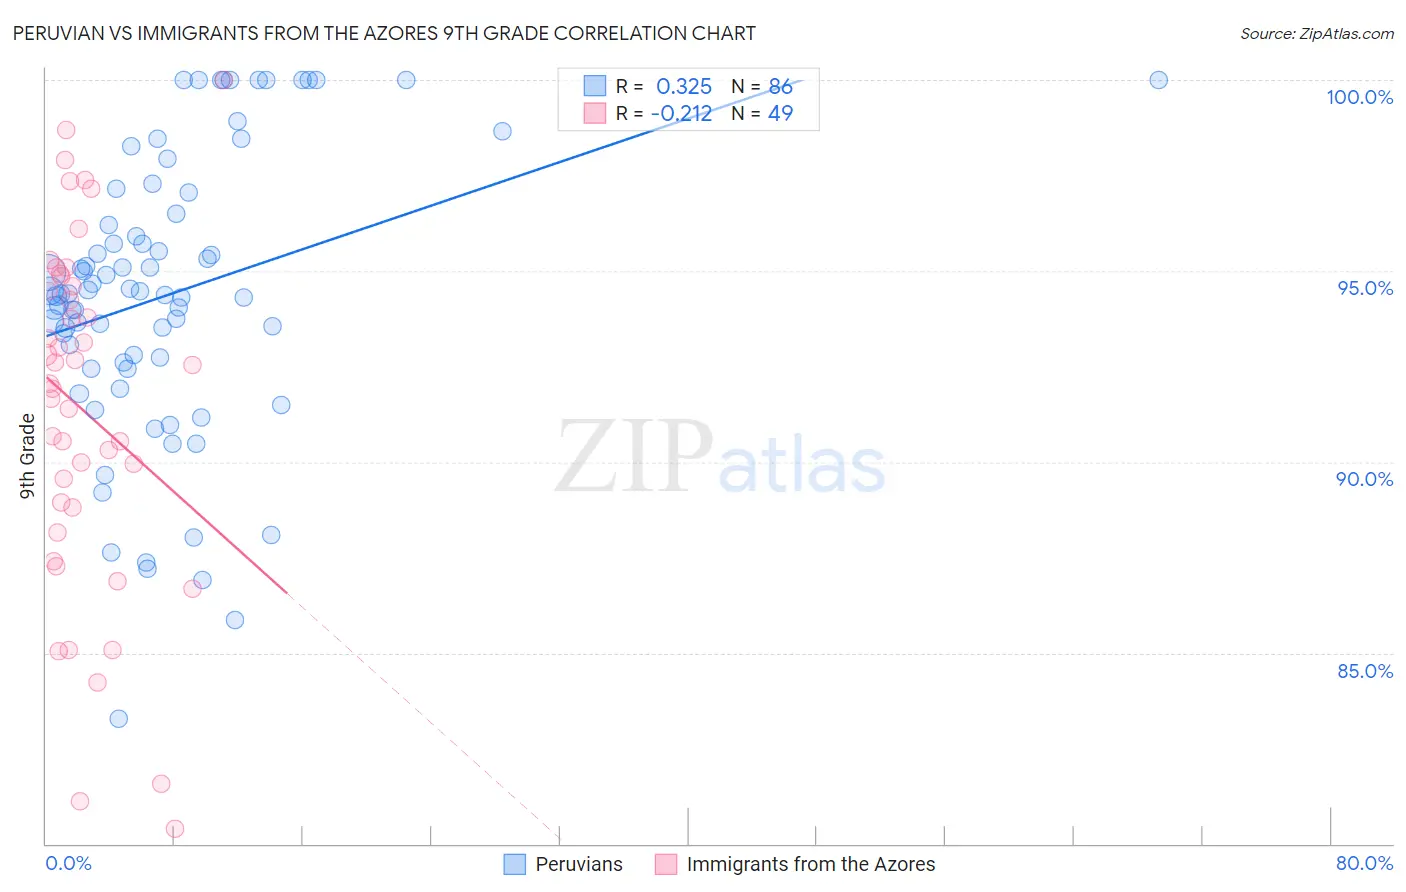
Peruvian vs Immigrants from the Azores 9th Grade Correlation Chart
The statistical analysis conducted on geographies consisting of 363,251,075 people shows a mild positive correlation between the proportion of Peruvians and percentage of population with at least 9th grade education in the United States with a correlation coefficient (R) of 0.325 and weighted average of 93.8%. Similarly, the statistical analysis conducted on geographies consisting of 46,257,310 people shows a weak negative correlation between the proportion of Immigrants from the Azores and percentage of population with at least 9th grade education in the United States with a correlation coefficient (R) of -0.212 and weighted average of 90.8%, a difference of 3.3%.
9th Grade Correlation Summary
| Measurement | Peruvian | Immigrants from the Azores |
| Minimum | 83.3% | 80.4% |
| Maximum | 100.0% | 100.0% |
| Range | 16.7% | 19.6% |
| Mean | 94.4% | 91.3% |
| Median | 94.4% | 92.1% |
| Interquartile 25% (IQ1) | 92.6% | 88.5% |
| Interquartile 75% (IQ3) | 96.5% | 94.7% |
| Interquartile Range (IQR) | 3.9% | 6.3% |
| Standard Deviation (Sample) | 3.7% | 4.6% |
| Standard Deviation (Population) | 3.7% | 4.6% |
Similar Demographics by 9th Grade
Demographics Similar to Peruvians by 9th Grade
In terms of 9th grade, the demographic groups most similar to Peruvians are Immigrants from South America (93.8%, a difference of 0.0%), Immigrants from Western Africa (93.8%, a difference of 0.010%), Immigrants from Colombia (93.8%, a difference of 0.010%), Immigrants from Ghana (93.8%, a difference of 0.020%), and West Indian (93.7%, a difference of 0.030%).
| Demographics | Rating | Rank | 9th Grade |
| Armenians | 0.3 /100 | #267 | Tragic 93.9% |
| Immigrants | Bolivia | 0.3 /100 | #268 | Tragic 93.9% |
| Immigrants | Uruguay | 0.2 /100 | #269 | Tragic 93.8% |
| Yuman | 0.2 /100 | #270 | Tragic 93.8% |
| Immigrants | Ghana | 0.2 /100 | #271 | Tragic 93.8% |
| Immigrants | Western Africa | 0.2 /100 | #272 | Tragic 93.8% |
| Immigrants | South America | 0.2 /100 | #273 | Tragic 93.8% |
| Peruvians | 0.2 /100 | #274 | Tragic 93.8% |
| Immigrants | Colombia | 0.2 /100 | #275 | Tragic 93.8% |
| West Indians | 0.2 /100 | #276 | Tragic 93.7% |
| Immigrants | Philippines | 0.1 /100 | #277 | Tragic 93.7% |
| Immigrants | Eritrea | 0.1 /100 | #278 | Tragic 93.7% |
| Trinidadians and Tobagonians | 0.1 /100 | #279 | Tragic 93.7% |
| Taiwanese | 0.1 /100 | #280 | Tragic 93.6% |
| Immigrants | Trinidad and Tobago | 0.1 /100 | #281 | Tragic 93.6% |
Demographics Similar to Immigrants from the Azores by 9th Grade
In terms of 9th grade, the demographic groups most similar to Immigrants from the Azores are Immigrants from Yemen (90.8%, a difference of 0.050%), Hispanic or Latino (90.9%, a difference of 0.14%), Mexican American Indian (90.9%, a difference of 0.16%), Immigrants from Honduras (90.6%, a difference of 0.17%), and Immigrants from Cabo Verde (90.9%, a difference of 0.19%).
| Demographics | Rating | Rank | 9th Grade |
| Immigrants | Nicaragua | 0.0 /100 | #327 | Tragic 91.3% |
| Dominicans | 0.0 /100 | #328 | Tragic 91.1% |
| Hondurans | 0.0 /100 | #329 | Tragic 91.0% |
| Immigrants | Cabo Verde | 0.0 /100 | #330 | Tragic 90.9% |
| Mexican American Indians | 0.0 /100 | #331 | Tragic 90.9% |
| Hispanics or Latinos | 0.0 /100 | #332 | Tragic 90.9% |
| Immigrants | Yemen | 0.0 /100 | #333 | Tragic 90.8% |
| Immigrants | Azores | 0.0 /100 | #334 | Tragic 90.8% |
| Immigrants | Honduras | 0.0 /100 | #335 | Tragic 90.6% |
| Immigrants | Dominican Republic | 0.0 /100 | #336 | Tragic 90.5% |
| Immigrants | Latin America | 0.0 /100 | #337 | Tragic 90.4% |
| Central Americans | 0.0 /100 | #338 | Tragic 90.4% |
| Yakama | 0.0 /100 | #339 | Tragic 90.1% |
| Mexicans | 0.0 /100 | #340 | Tragic 90.0% |
| Guatemalans | 0.0 /100 | #341 | Tragic 89.9% |