Pennsylvania German vs Immigrants from Sweden GED/Equivalency
COMPARE
Pennsylvania German
Immigrants from Sweden
GED/Equivalency
GED/Equivalency Comparison
Pennsylvania Germans
Immigrants from Sweden
82.9%
GED/EQUIVALENCY
0.1/ 100
METRIC RATING
273rd/ 347
METRIC RANK
88.4%
GED/EQUIVALENCY
99.7/ 100
METRIC RATING
33rd/ 347
METRIC RANK
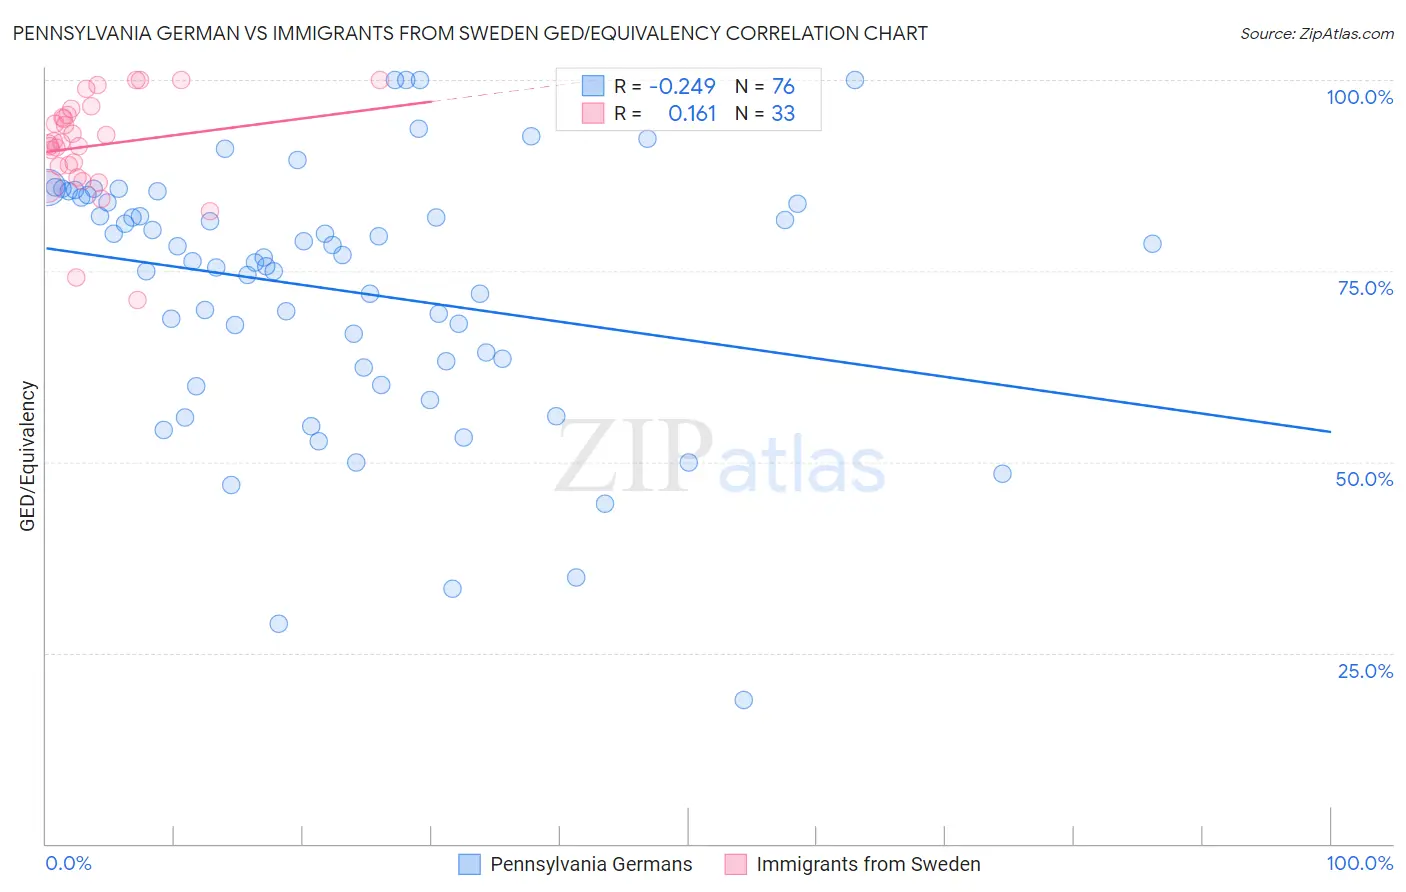
Pennsylvania German vs Immigrants from Sweden GED/Equivalency Correlation Chart
The statistical analysis conducted on geographies consisting of 234,102,935 people shows a weak negative correlation between the proportion of Pennsylvania Germans and percentage of population with at least ged/equivalency education in the United States with a correlation coefficient (R) of -0.249 and weighted average of 82.9%. Similarly, the statistical analysis conducted on geographies consisting of 164,737,092 people shows a poor positive correlation between the proportion of Immigrants from Sweden and percentage of population with at least ged/equivalency education in the United States with a correlation coefficient (R) of 0.161 and weighted average of 88.4%, a difference of 6.7%.
GED/Equivalency Correlation Summary
| Measurement | Pennsylvania German | Immigrants from Sweden |
| Minimum | 18.8% | 71.2% |
| Maximum | 100.0% | 100.0% |
| Range | 81.2% | 28.8% |
| Mean | 72.5% | 91.4% |
| Median | 76.5% | 91.8% |
| Interquartile 25% (IQ1) | 62.8% | 88.0% |
| Interquartile 75% (IQ3) | 84.3% | 95.8% |
| Interquartile Range (IQR) | 21.5% | 7.8% |
| Standard Deviation (Sample) | 17.0% | 6.8% |
| Standard Deviation (Population) | 16.9% | 6.6% |
Similar Demographics by GED/Equivalency
Demographics Similar to Pennsylvania Germans by GED/Equivalency
In terms of ged/equivalency, the demographic groups most similar to Pennsylvania Germans are Barbadian (82.9%, a difference of 0.010%), Immigrants from Trinidad and Tobago (82.8%, a difference of 0.020%), U.S. Virgin Islander (82.9%, a difference of 0.050%), Seminole (82.8%, a difference of 0.080%), and Immigrants from Jamaica (82.9%, a difference of 0.090%).
| Demographics | Rating | Rank | GED/Equivalency |
| Kiowa | 0.2 /100 | #266 | Tragic 83.1% |
| Trinidadians and Tobagonians | 0.2 /100 | #267 | Tragic 83.0% |
| Immigrants | Burma/Myanmar | 0.2 /100 | #268 | Tragic 83.0% |
| Hopi | 0.2 /100 | #269 | Tragic 83.0% |
| Immigrants | Jamaica | 0.2 /100 | #270 | Tragic 82.9% |
| U.S. Virgin Islanders | 0.2 /100 | #271 | Tragic 82.9% |
| Barbadians | 0.1 /100 | #272 | Tragic 82.9% |
| Pennsylvania Germans | 0.1 /100 | #273 | Tragic 82.9% |
| Immigrants | Trinidad and Tobago | 0.1 /100 | #274 | Tragic 82.8% |
| Seminole | 0.1 /100 | #275 | Tragic 82.8% |
| Blacks/African Americans | 0.1 /100 | #276 | Tragic 82.8% |
| Arapaho | 0.1 /100 | #277 | Tragic 82.8% |
| Immigrants | Laos | 0.1 /100 | #278 | Tragic 82.7% |
| Immigrants | Fiji | 0.1 /100 | #279 | Tragic 82.7% |
| Cheyenne | 0.1 /100 | #280 | Tragic 82.7% |
Demographics Similar to Immigrants from Sweden by GED/Equivalency
In terms of ged/equivalency, the demographic groups most similar to Immigrants from Sweden are Immigrants from Japan (88.4%, a difference of 0.010%), Immigrants from South Central Asia (88.4%, a difference of 0.020%), Danish (88.4%, a difference of 0.040%), Immigrants from Belgium (88.3%, a difference of 0.050%), and Bhutanese (88.4%, a difference of 0.060%).
| Demographics | Rating | Rank | GED/Equivalency |
| Immigrants | Australia | 99.8 /100 | #26 | Exceptional 88.6% |
| Immigrants | Lithuania | 99.8 /100 | #27 | Exceptional 88.6% |
| Immigrants | Northern Europe | 99.8 /100 | #28 | Exceptional 88.5% |
| Poles | 99.8 /100 | #29 | Exceptional 88.5% |
| Turks | 99.8 /100 | #30 | Exceptional 88.5% |
| Bhutanese | 99.8 /100 | #31 | Exceptional 88.4% |
| Danes | 99.8 /100 | #32 | Exceptional 88.4% |
| Immigrants | Sweden | 99.7 /100 | #33 | Exceptional 88.4% |
| Immigrants | Japan | 99.7 /100 | #34 | Exceptional 88.4% |
| Immigrants | South Central Asia | 99.7 /100 | #35 | Exceptional 88.4% |
| Immigrants | Belgium | 99.7 /100 | #36 | Exceptional 88.3% |
| Immigrants | Austria | 99.7 /100 | #37 | Exceptional 88.3% |
| Burmese | 99.7 /100 | #38 | Exceptional 88.3% |
| Immigrants | Israel | 99.6 /100 | #39 | Exceptional 88.2% |
| Italians | 99.6 /100 | #40 | Exceptional 88.2% |