Palestinian vs Immigrants from Nicaragua Master's Degree
COMPARE
Palestinian
Immigrants from Nicaragua
Master's Degree
Master's Degree Comparison
Palestinians
Immigrants from Nicaragua
16.3%
MASTER'S DEGREE
94.8/ 100
METRIC RATING
127th/ 347
METRIC RANK
11.8%
MASTER'S DEGREE
0.2/ 100
METRIC RATING
285th/ 347
METRIC RANK
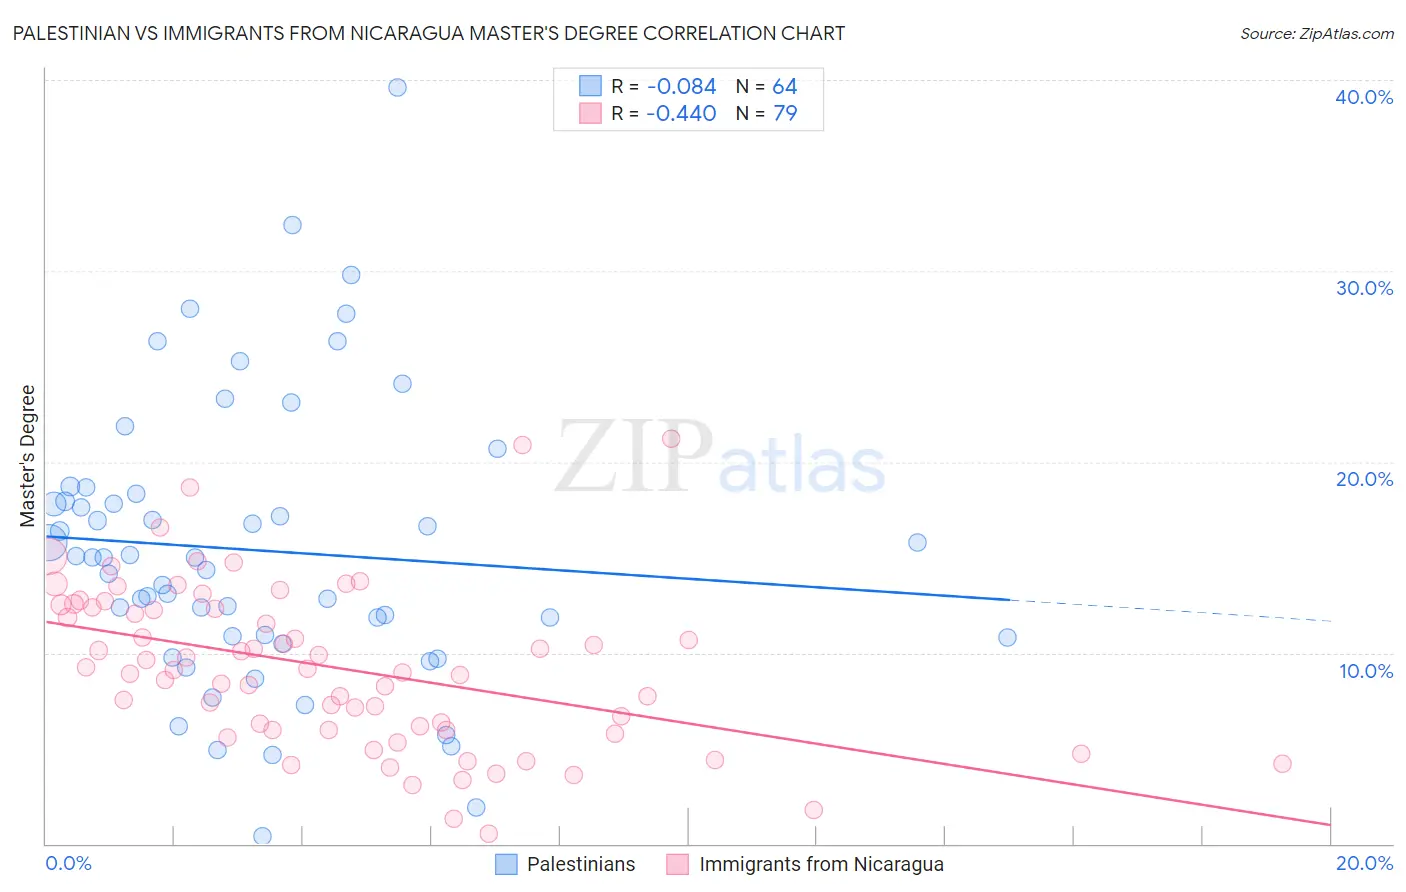
Palestinian vs Immigrants from Nicaragua Master's Degree Correlation Chart
The statistical analysis conducted on geographies consisting of 216,432,261 people shows a slight negative correlation between the proportion of Palestinians and percentage of population with at least master's degree education in the United States with a correlation coefficient (R) of -0.084 and weighted average of 16.3%. Similarly, the statistical analysis conducted on geographies consisting of 236,327,248 people shows a moderate negative correlation between the proportion of Immigrants from Nicaragua and percentage of population with at least master's degree education in the United States with a correlation coefficient (R) of -0.440 and weighted average of 11.8%, a difference of 37.7%.
Master's Degree Correlation Summary
| Measurement | Palestinian | Immigrants from Nicaragua |
| Minimum | 0.42% | 0.53% |
| Maximum | 39.6% | 21.2% |
| Range | 39.2% | 20.7% |
| Mean | 15.4% | 9.2% |
| Median | 15.0% | 9.1% |
| Interquartile 25% (IQ1) | 10.8% | 6.0% |
| Interquartile 75% (IQ3) | 18.1% | 12.4% |
| Interquartile Range (IQR) | 7.3% | 6.4% |
| Standard Deviation (Sample) | 7.4% | 4.3% |
| Standard Deviation (Population) | 7.4% | 4.3% |
Similar Demographics by Master's Degree
Demographics Similar to Palestinians by Master's Degree
In terms of master's degree, the demographic groups most similar to Palestinians are Immigrants from Sierra Leone (16.3%, a difference of 0.050%), Immigrants from Eastern Africa (16.3%, a difference of 0.26%), Italian (16.4%, a difference of 0.37%), Immigrants from Eritrea (16.4%, a difference of 0.45%), and Croatian (16.4%, a difference of 0.52%).
| Demographics | Rating | Rank | Master's Degree |
| Lebanese | 96.4 /100 | #120 | Exceptional 16.5% |
| Afghans | 96.2 /100 | #121 | Exceptional 16.5% |
| British | 95.6 /100 | #122 | Exceptional 16.4% |
| Croatians | 95.6 /100 | #123 | Exceptional 16.4% |
| Immigrants | Eritrea | 95.5 /100 | #124 | Exceptional 16.4% |
| Italians | 95.4 /100 | #125 | Exceptional 16.4% |
| Immigrants | Eastern Africa | 95.2 /100 | #126 | Exceptional 16.3% |
| Palestinians | 94.8 /100 | #127 | Exceptional 16.3% |
| Immigrants | Sierra Leone | 94.7 /100 | #128 | Exceptional 16.3% |
| Immigrants | Syria | 93.3 /100 | #129 | Exceptional 16.2% |
| Immigrants | Jordan | 92.7 /100 | #130 | Exceptional 16.1% |
| Taiwanese | 91.9 /100 | #131 | Exceptional 16.1% |
| Serbians | 91.7 /100 | #132 | Exceptional 16.1% |
| Immigrants | Sudan | 90.2 /100 | #133 | Exceptional 16.0% |
| Venezuelans | 88.4 /100 | #134 | Excellent 15.9% |
Demographics Similar to Immigrants from Nicaragua by Master's Degree
In terms of master's degree, the demographic groups most similar to Immigrants from Nicaragua are Ottawa (11.9%, a difference of 0.18%), Aleut (11.8%, a difference of 0.35%), Immigrants from Haiti (11.8%, a difference of 0.55%), Immigrants from Honduras (11.8%, a difference of 0.72%), and Guatemalan (11.7%, a difference of 0.80%).
| Demographics | Rating | Rank | Master's Degree |
| Potawatomi | 0.3 /100 | #278 | Tragic 12.1% |
| Immigrants | Belize | 0.2 /100 | #279 | Tragic 12.1% |
| Immigrants | Dominican Republic | 0.2 /100 | #280 | Tragic 12.1% |
| Malaysians | 0.2 /100 | #281 | Tragic 12.0% |
| Immigrants | El Salvador | 0.2 /100 | #282 | Tragic 12.0% |
| Hondurans | 0.2 /100 | #283 | Tragic 11.9% |
| Ottawa | 0.2 /100 | #284 | Tragic 11.9% |
| Immigrants | Nicaragua | 0.2 /100 | #285 | Tragic 11.8% |
| Aleuts | 0.1 /100 | #286 | Tragic 11.8% |
| Immigrants | Haiti | 0.1 /100 | #287 | Tragic 11.8% |
| Immigrants | Honduras | 0.1 /100 | #288 | Tragic 11.8% |
| Guatemalans | 0.1 /100 | #289 | Tragic 11.7% |
| Ute | 0.1 /100 | #290 | Tragic 11.7% |
| Colville | 0.1 /100 | #291 | Tragic 11.6% |
| Immigrants | Guatemala | 0.1 /100 | #292 | Tragic 11.6% |