Palestinian vs Immigrants from Zaire Master's Degree
COMPARE
Palestinian
Immigrants from Zaire
Master's Degree
Master's Degree Comparison
Palestinians
Immigrants from Zaire
16.3%
MASTER'S DEGREE
94.8/ 100
METRIC RATING
127th/ 347
METRIC RANK
14.7%
MASTER'S DEGREE
39.5/ 100
METRIC RATING
184th/ 347
METRIC RANK
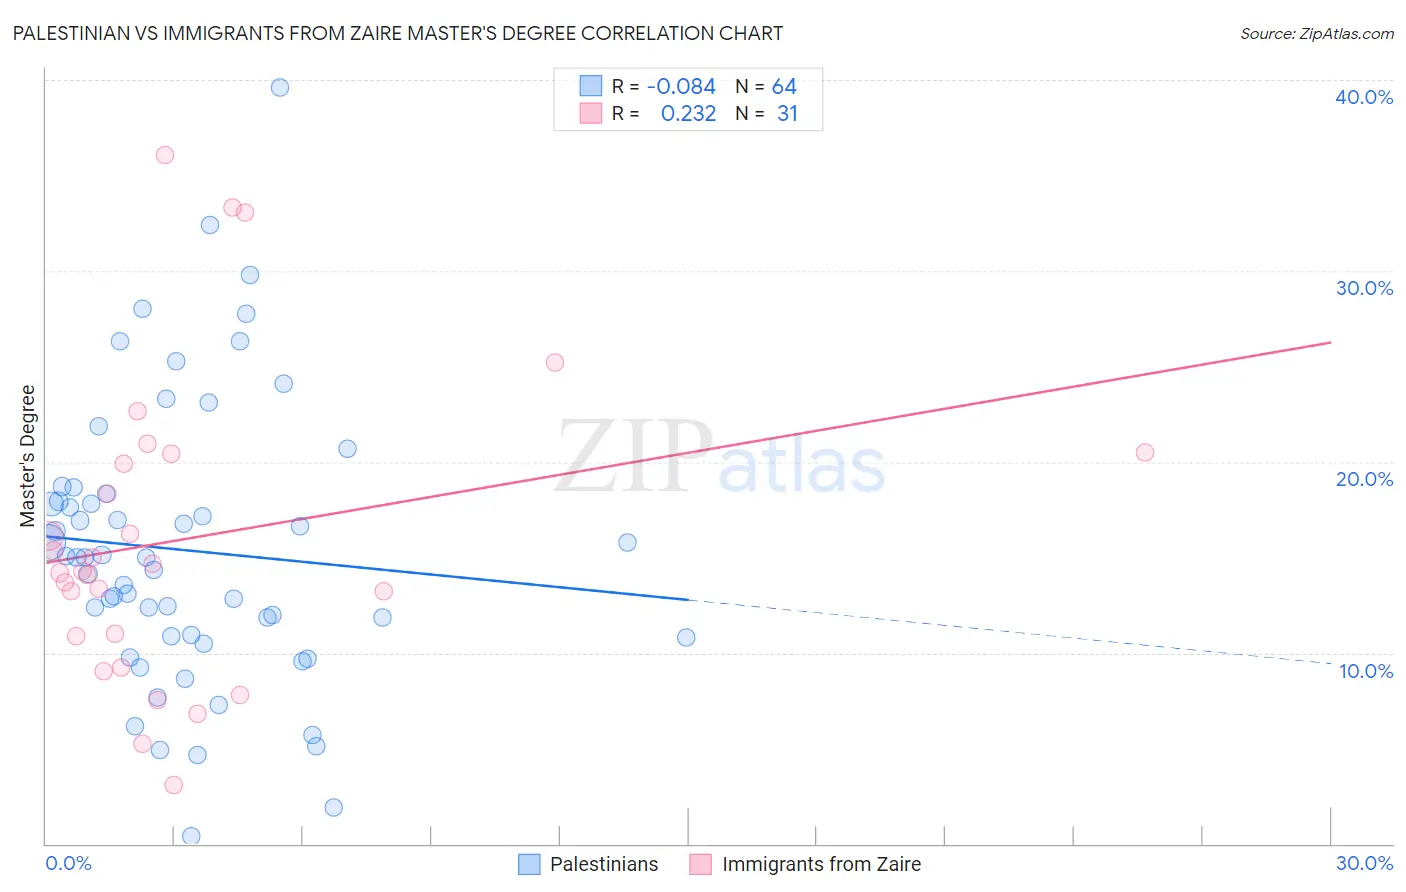
Palestinian vs Immigrants from Zaire Master's Degree Correlation Chart
The statistical analysis conducted on geographies consisting of 216,432,261 people shows a slight negative correlation between the proportion of Palestinians and percentage of population with at least master's degree education in the United States with a correlation coefficient (R) of -0.084 and weighted average of 16.3%. Similarly, the statistical analysis conducted on geographies consisting of 107,246,977 people shows a weak positive correlation between the proportion of Immigrants from Zaire and percentage of population with at least master's degree education in the United States with a correlation coefficient (R) of 0.232 and weighted average of 14.7%, a difference of 10.8%.
Master's Degree Correlation Summary
| Measurement | Palestinian | Immigrants from Zaire |
| Minimum | 0.42% | 3.1% |
| Maximum | 39.6% | 36.1% |
| Range | 39.2% | 33.0% |
| Mean | 15.4% | 15.9% |
| Median | 15.0% | 14.3% |
| Interquartile 25% (IQ1) | 10.8% | 10.9% |
| Interquartile 75% (IQ3) | 18.1% | 20.4% |
| Interquartile Range (IQR) | 7.3% | 9.6% |
| Standard Deviation (Sample) | 7.4% | 8.0% |
| Standard Deviation (Population) | 7.4% | 7.8% |
Similar Demographics by Master's Degree
Demographics Similar to Palestinians by Master's Degree
In terms of master's degree, the demographic groups most similar to Palestinians are Immigrants from Sierra Leone (16.3%, a difference of 0.050%), Immigrants from Eastern Africa (16.3%, a difference of 0.26%), Italian (16.4%, a difference of 0.37%), Immigrants from Eritrea (16.4%, a difference of 0.45%), and Croatian (16.4%, a difference of 0.52%).
| Demographics | Rating | Rank | Master's Degree |
| Lebanese | 96.4 /100 | #120 | Exceptional 16.5% |
| Afghans | 96.2 /100 | #121 | Exceptional 16.5% |
| British | 95.6 /100 | #122 | Exceptional 16.4% |
| Croatians | 95.6 /100 | #123 | Exceptional 16.4% |
| Immigrants | Eritrea | 95.5 /100 | #124 | Exceptional 16.4% |
| Italians | 95.4 /100 | #125 | Exceptional 16.4% |
| Immigrants | Eastern Africa | 95.2 /100 | #126 | Exceptional 16.3% |
| Palestinians | 94.8 /100 | #127 | Exceptional 16.3% |
| Immigrants | Sierra Leone | 94.7 /100 | #128 | Exceptional 16.3% |
| Immigrants | Syria | 93.3 /100 | #129 | Exceptional 16.2% |
| Immigrants | Jordan | 92.7 /100 | #130 | Exceptional 16.1% |
| Taiwanese | 91.9 /100 | #131 | Exceptional 16.1% |
| Serbians | 91.7 /100 | #132 | Exceptional 16.1% |
| Immigrants | Sudan | 90.2 /100 | #133 | Exceptional 16.0% |
| Venezuelans | 88.4 /100 | #134 | Excellent 15.9% |
Demographics Similar to Immigrants from Zaire by Master's Degree
In terms of master's degree, the demographic groups most similar to Immigrants from Zaire are Sri Lankan (14.7%, a difference of 0.020%), Czech (14.7%, a difference of 0.12%), Barbadian (14.7%, a difference of 0.16%), Swiss (14.7%, a difference of 0.22%), and Immigrants from Iraq (14.8%, a difference of 0.25%).
| Demographics | Rating | Rank | Master's Degree |
| Immigrants | Colombia | 48.3 /100 | #177 | Average 14.9% |
| English | 45.0 /100 | #178 | Average 14.8% |
| Immigrants | Iraq | 41.3 /100 | #179 | Average 14.8% |
| Celtics | 41.3 /100 | #180 | Average 14.8% |
| Swiss | 41.1 /100 | #181 | Average 14.7% |
| Czechs | 40.4 /100 | #182 | Average 14.7% |
| Sri Lankans | 39.6 /100 | #183 | Fair 14.7% |
| Immigrants | Zaire | 39.5 /100 | #184 | Fair 14.7% |
| Barbadians | 38.3 /100 | #185 | Fair 14.7% |
| Immigrants | Oceania | 37.1 /100 | #186 | Fair 14.7% |
| Basques | 36.5 /100 | #187 | Fair 14.7% |
| Immigrants | Costa Rica | 36.2 /100 | #188 | Fair 14.7% |
| Immigrants | Immigrants | 36.0 /100 | #189 | Fair 14.6% |
| Spaniards | 35.8 /100 | #190 | Fair 14.6% |
| Welsh | 34.2 /100 | #191 | Fair 14.6% |