Palestinian vs Immigrants from Malaysia Master's Degree
COMPARE
Palestinian
Immigrants from Malaysia
Master's Degree
Master's Degree Comparison
Palestinians
Immigrants from Malaysia
16.3%
MASTER'S DEGREE
94.8/ 100
METRIC RATING
127th/ 347
METRIC RANK
18.9%
MASTER'S DEGREE
100.0/ 100
METRIC RATING
44th/ 347
METRIC RANK
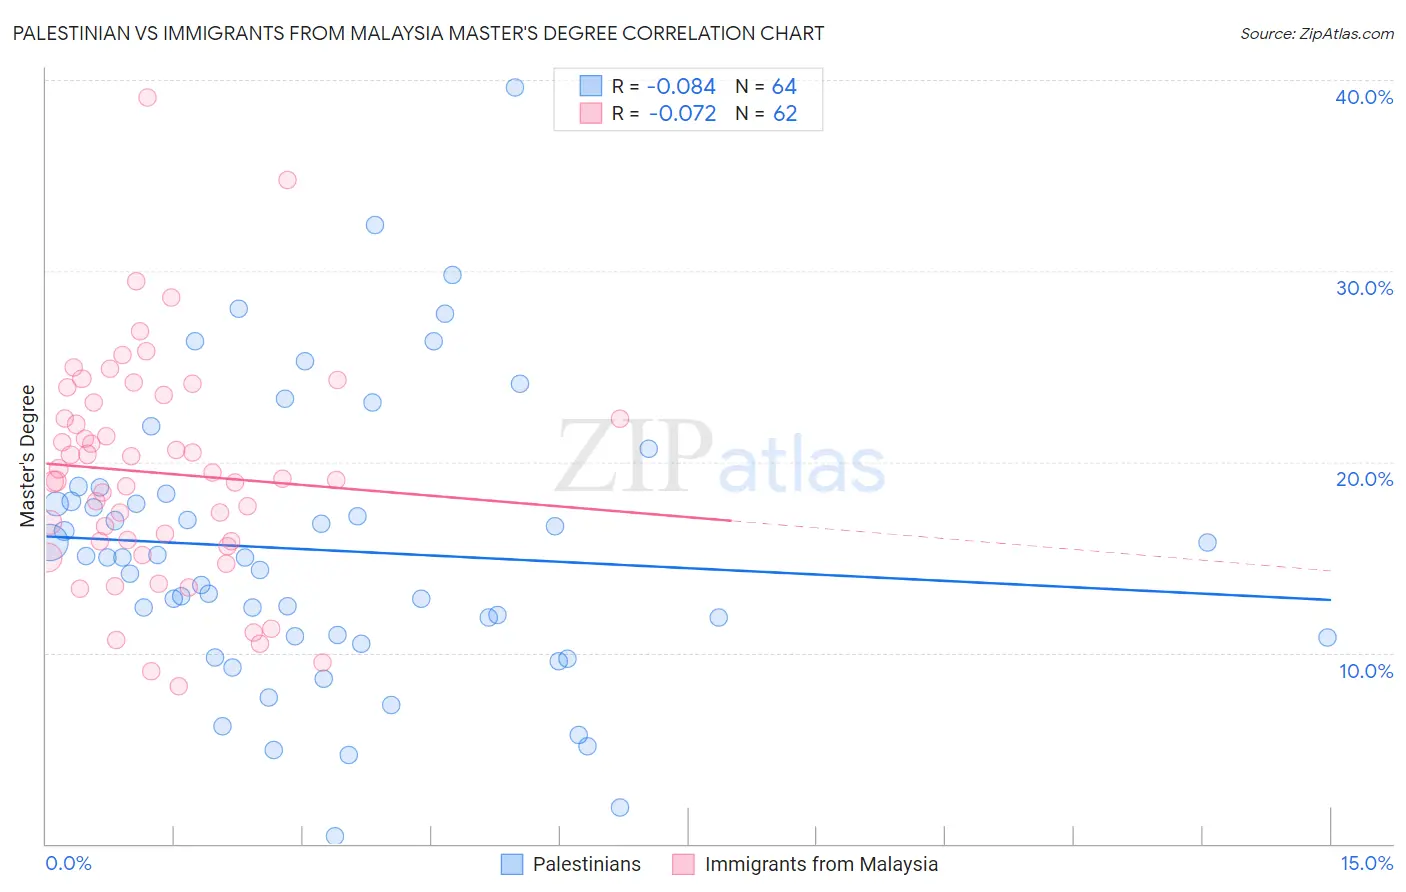
Palestinian vs Immigrants from Malaysia Master's Degree Correlation Chart
The statistical analysis conducted on geographies consisting of 216,432,261 people shows a slight negative correlation between the proportion of Palestinians and percentage of population with at least master's degree education in the United States with a correlation coefficient (R) of -0.084 and weighted average of 16.3%. Similarly, the statistical analysis conducted on geographies consisting of 197,962,385 people shows a slight negative correlation between the proportion of Immigrants from Malaysia and percentage of population with at least master's degree education in the United States with a correlation coefficient (R) of -0.072 and weighted average of 18.9%, a difference of 16.0%.
Master's Degree Correlation Summary
| Measurement | Palestinian | Immigrants from Malaysia |
| Minimum | 0.42% | 8.3% |
| Maximum | 39.6% | 39.1% |
| Range | 39.2% | 30.8% |
| Mean | 15.4% | 19.4% |
| Median | 15.0% | 19.1% |
| Interquartile 25% (IQ1) | 10.8% | 15.8% |
| Interquartile 75% (IQ3) | 18.1% | 23.1% |
| Interquartile Range (IQR) | 7.3% | 7.3% |
| Standard Deviation (Sample) | 7.4% | 5.9% |
| Standard Deviation (Population) | 7.4% | 5.8% |
Similar Demographics by Master's Degree
Demographics Similar to Palestinians by Master's Degree
In terms of master's degree, the demographic groups most similar to Palestinians are Immigrants from Sierra Leone (16.3%, a difference of 0.050%), Immigrants from Eastern Africa (16.3%, a difference of 0.26%), Italian (16.4%, a difference of 0.37%), Immigrants from Eritrea (16.4%, a difference of 0.45%), and Croatian (16.4%, a difference of 0.52%).
| Demographics | Rating | Rank | Master's Degree |
| Lebanese | 96.4 /100 | #120 | Exceptional 16.5% |
| Afghans | 96.2 /100 | #121 | Exceptional 16.5% |
| British | 95.6 /100 | #122 | Exceptional 16.4% |
| Croatians | 95.6 /100 | #123 | Exceptional 16.4% |
| Immigrants | Eritrea | 95.5 /100 | #124 | Exceptional 16.4% |
| Italians | 95.4 /100 | #125 | Exceptional 16.4% |
| Immigrants | Eastern Africa | 95.2 /100 | #126 | Exceptional 16.3% |
| Palestinians | 94.8 /100 | #127 | Exceptional 16.3% |
| Immigrants | Sierra Leone | 94.7 /100 | #128 | Exceptional 16.3% |
| Immigrants | Syria | 93.3 /100 | #129 | Exceptional 16.2% |
| Immigrants | Jordan | 92.7 /100 | #130 | Exceptional 16.1% |
| Taiwanese | 91.9 /100 | #131 | Exceptional 16.1% |
| Serbians | 91.7 /100 | #132 | Exceptional 16.1% |
| Immigrants | Sudan | 90.2 /100 | #133 | Exceptional 16.0% |
| Venezuelans | 88.4 /100 | #134 | Excellent 15.9% |
Demographics Similar to Immigrants from Malaysia by Master's Degree
In terms of master's degree, the demographic groups most similar to Immigrants from Malaysia are Immigrants from Belarus (18.9%, a difference of 0.11%), Immigrants from Greece (19.0%, a difference of 0.28%), Immigrants from Saudi Arabia (19.0%, a difference of 0.29%), Immigrants from Norway (18.8%, a difference of 0.50%), and Immigrants from Austria (18.8%, a difference of 0.51%).
| Demographics | Rating | Rank | Master's Degree |
| Mongolians | 100.0 /100 | #37 | Exceptional 19.4% |
| Bolivians | 100.0 /100 | #38 | Exceptional 19.3% |
| Immigrants | Spain | 100.0 /100 | #39 | Exceptional 19.1% |
| Immigrants | Bolivia | 100.0 /100 | #40 | Exceptional 19.1% |
| Immigrants | Latvia | 100.0 /100 | #41 | Exceptional 19.1% |
| Immigrants | Saudi Arabia | 100.0 /100 | #42 | Exceptional 19.0% |
| Immigrants | Greece | 100.0 /100 | #43 | Exceptional 19.0% |
| Immigrants | Malaysia | 100.0 /100 | #44 | Exceptional 18.9% |
| Immigrants | Belarus | 100.0 /100 | #45 | Exceptional 18.9% |
| Immigrants | Norway | 100.0 /100 | #46 | Exceptional 18.8% |
| Immigrants | Austria | 100.0 /100 | #47 | Exceptional 18.8% |
| Paraguayans | 100.0 /100 | #48 | Exceptional 18.8% |
| Estonians | 100.0 /100 | #49 | Exceptional 18.8% |
| Bulgarians | 100.0 /100 | #50 | Exceptional 18.8% |
| Immigrants | South Africa | 100.0 /100 | #51 | Exceptional 18.8% |