Osage vs Yugoslavian 7th Grade
COMPARE
Osage
Yugoslavian
7th Grade
7th Grade Comparison
Osage
Yugoslavians
96.7%
7TH GRADE
98.9/ 100
METRIC RATING
91st/ 347
METRIC RANK
96.8%
7TH GRADE
99.3/ 100
METRIC RATING
80th/ 347
METRIC RANK
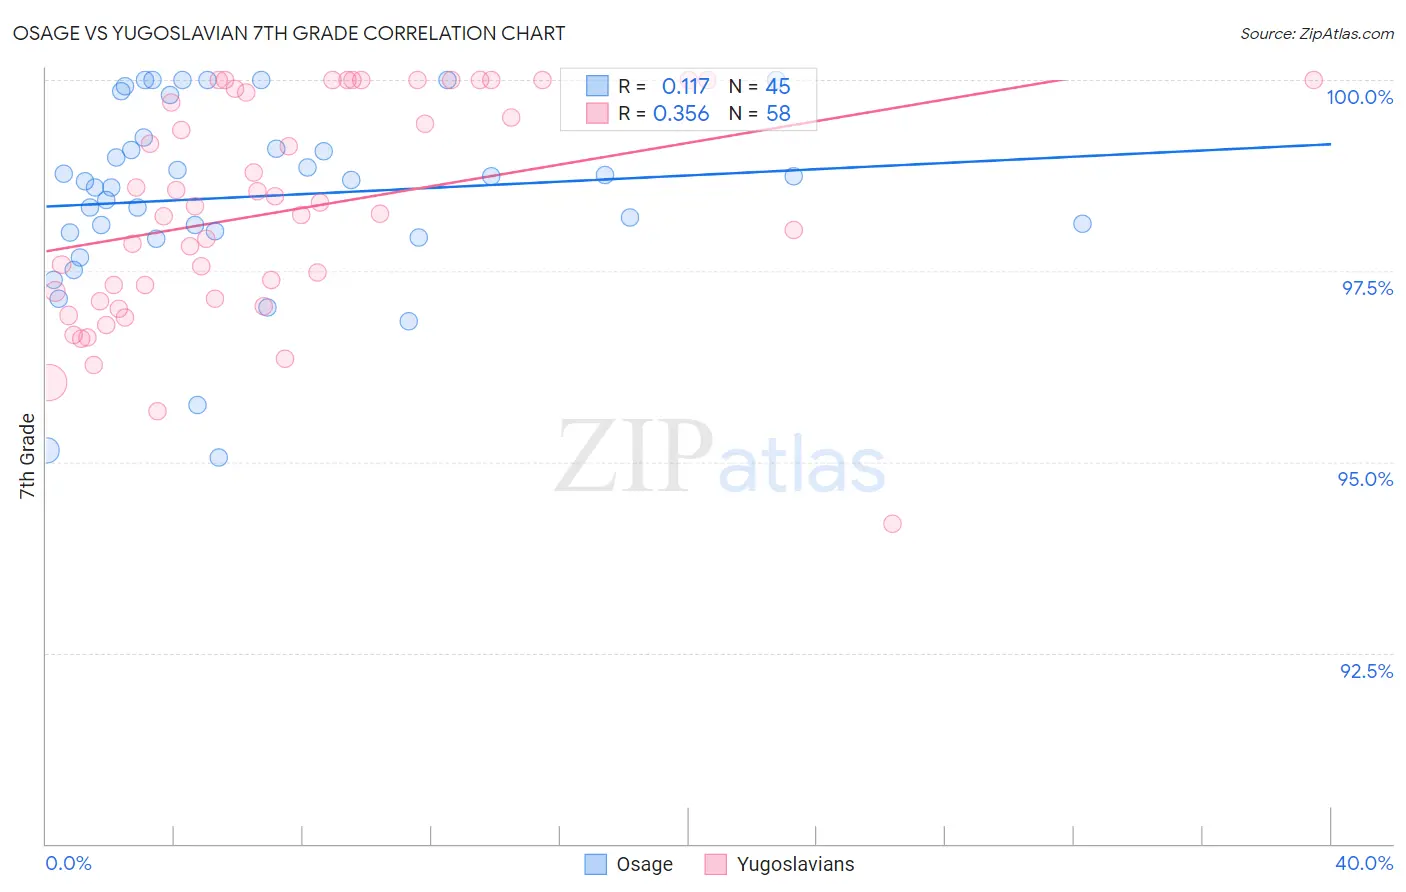
Osage vs Yugoslavian 7th Grade Correlation Chart
The statistical analysis conducted on geographies consisting of 91,808,929 people shows a poor positive correlation between the proportion of Osage and percentage of population with at least 7th grade education in the United States with a correlation coefficient (R) of 0.117 and weighted average of 96.7%. Similarly, the statistical analysis conducted on geographies consisting of 285,618,157 people shows a mild positive correlation between the proportion of Yugoslavians and percentage of population with at least 7th grade education in the United States with a correlation coefficient (R) of 0.356 and weighted average of 96.8%, a difference of 0.070%.
7th Grade Correlation Summary
| Measurement | Osage | Yugoslavian |
| Minimum | 95.1% | 94.2% |
| Maximum | 100.0% | 100.0% |
| Range | 4.9% | 5.8% |
| Mean | 98.5% | 98.3% |
| Median | 98.7% | 98.3% |
| Interquartile 25% (IQ1) | 98.0% | 97.1% |
| Interquartile 75% (IQ3) | 99.2% | 99.9% |
| Interquartile Range (IQR) | 1.2% | 2.7% |
| Standard Deviation (Sample) | 1.2% | 1.4% |
| Standard Deviation (Population) | 1.2% | 1.4% |
Demographics Similar to Osage and Yugoslavians by 7th Grade
In terms of 7th grade, the demographic groups most similar to Osage are Immigrants from South Africa (96.7%, a difference of 0.0%), Immigrants from Western Europe (96.7%, a difference of 0.0%), Potawatomi (96.7%, a difference of 0.0%), Immigrants from Belgium (96.7%, a difference of 0.010%), and Puget Sound Salish (96.7%, a difference of 0.010%). Similarly, the demographic groups most similar to Yugoslavians are Immigrants from Netherlands (96.8%, a difference of 0.0%), Cypriot (96.8%, a difference of 0.0%), Immigrants from Ireland (96.8%, a difference of 0.010%), Cherokee (96.8%, a difference of 0.010%), and Delaware (96.8%, a difference of 0.020%).
| Demographics | Rating | Rank | 7th Grade |
| Zimbabweans | 99.5 /100 | #75 | Exceptional 96.8% |
| Immigrants | Ireland | 99.4 /100 | #76 | Exceptional 96.8% |
| Cherokee | 99.4 /100 | #77 | Exceptional 96.8% |
| Immigrants | Netherlands | 99.3 /100 | #78 | Exceptional 96.8% |
| Cypriots | 99.3 /100 | #79 | Exceptional 96.8% |
| Yugoslavians | 99.3 /100 | #80 | Exceptional 96.8% |
| Delaware | 99.2 /100 | #81 | Exceptional 96.8% |
| Chickasaw | 99.2 /100 | #82 | Exceptional 96.7% |
| Icelanders | 99.1 /100 | #83 | Exceptional 96.7% |
| Romanians | 99.1 /100 | #84 | Exceptional 96.7% |
| Kiowa | 99.1 /100 | #85 | Exceptional 96.7% |
| Turks | 99.1 /100 | #86 | Exceptional 96.7% |
| Immigrants | Belgium | 99.0 /100 | #87 | Exceptional 96.7% |
| Puget Sound Salish | 99.0 /100 | #88 | Exceptional 96.7% |
| Cree | 99.0 /100 | #89 | Exceptional 96.7% |
| Immigrants | South Africa | 98.9 /100 | #90 | Exceptional 96.7% |
| Osage | 98.9 /100 | #91 | Exceptional 96.7% |
| Immigrants | Western Europe | 98.9 /100 | #92 | Exceptional 96.7% |
| Potawatomi | 98.9 /100 | #93 | Exceptional 96.7% |
| Lebanese | 98.8 /100 | #94 | Exceptional 96.7% |
| Immigrants | Australia | 98.8 /100 | #95 | Exceptional 96.7% |