Osage vs Immigrants from Japan Master's Degree
COMPARE
Osage
Immigrants from Japan
Master's Degree
Master's Degree Comparison
Osage
Immigrants from Japan
12.6%
MASTER'S DEGREE
0.7/ 100
METRIC RATING
257th/ 347
METRIC RANK
20.0%
MASTER'S DEGREE
100.0/ 100
METRIC RATING
25th/ 347
METRIC RANK
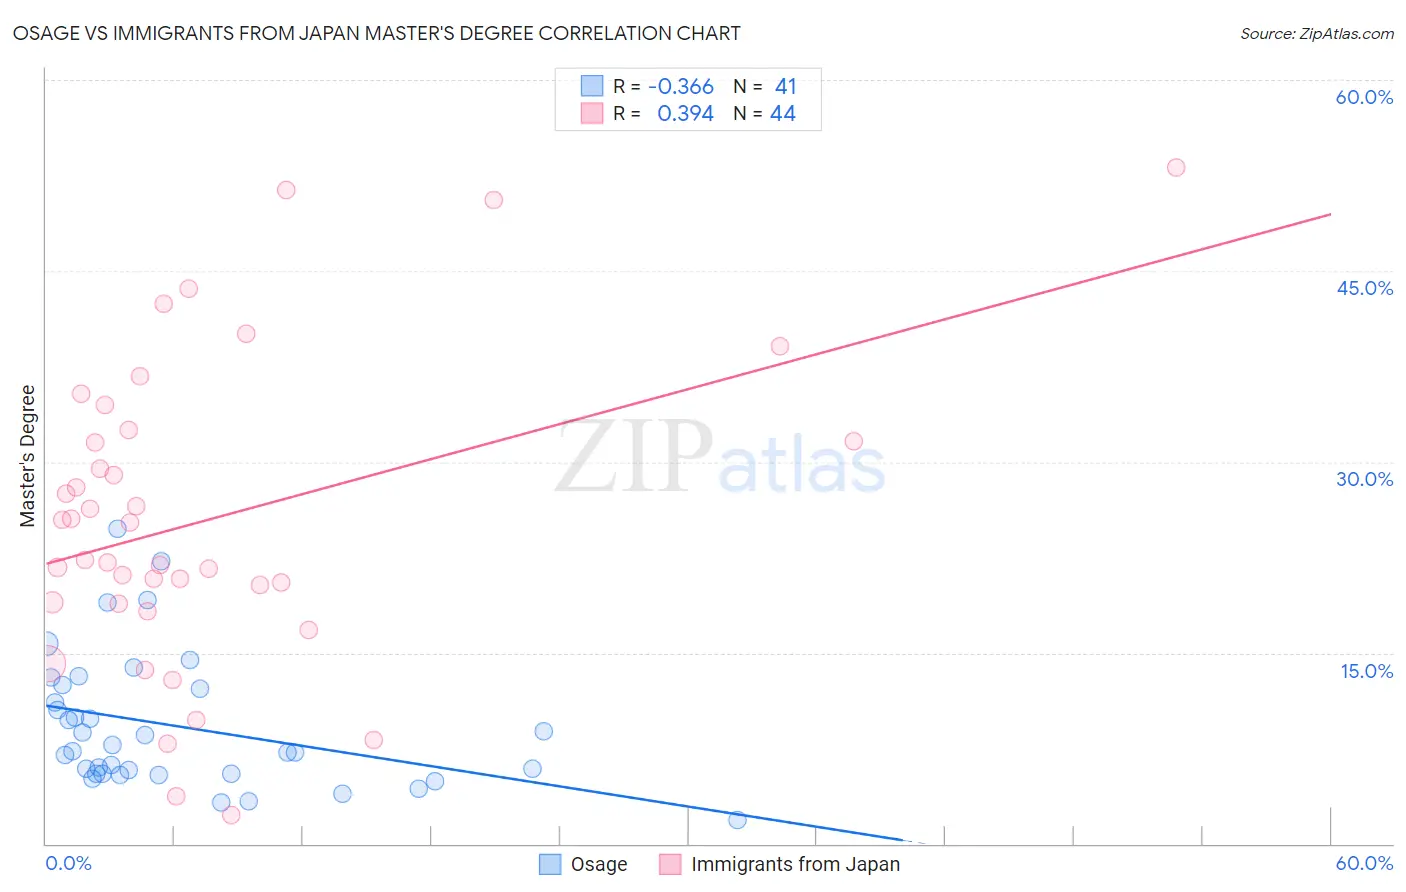
Osage vs Immigrants from Japan Master's Degree Correlation Chart
The statistical analysis conducted on geographies consisting of 91,790,824 people shows a mild negative correlation between the proportion of Osage and percentage of population with at least master's degree education in the United States with a correlation coefficient (R) of -0.366 and weighted average of 12.6%. Similarly, the statistical analysis conducted on geographies consisting of 340,075,167 people shows a mild positive correlation between the proportion of Immigrants from Japan and percentage of population with at least master's degree education in the United States with a correlation coefficient (R) of 0.394 and weighted average of 20.0%, a difference of 59.2%.
Master's Degree Correlation Summary
| Measurement | Osage | Immigrants from Japan |
| Minimum | 1.9% | 2.2% |
| Maximum | 24.8% | 53.1% |
| Range | 22.9% | 50.9% |
| Mean | 9.2% | 25.5% |
| Median | 7.2% | 23.8% |
| Interquartile 25% (IQ1) | 5.5% | 18.9% |
| Interquartile 75% (IQ3) | 12.3% | 32.1% |
| Interquartile Range (IQR) | 6.9% | 13.2% |
| Standard Deviation (Sample) | 5.3% | 12.0% |
| Standard Deviation (Population) | 5.2% | 11.9% |
Similar Demographics by Master's Degree
Demographics Similar to Osage by Master's Degree
In terms of master's degree, the demographic groups most similar to Osage are Immigrants from Portugal (12.6%, a difference of 0.48%), Immigrants from Liberia (12.5%, a difference of 0.50%), Immigrants from Congo (12.6%, a difference of 0.55%), Indonesian (12.6%, a difference of 0.58%), and Japanese (12.5%, a difference of 0.59%).
| Demographics | Rating | Rank | Master's Degree |
| Liberians | 1.3 /100 | #250 | Tragic 12.8% |
| Tlingit-Haida | 1.3 /100 | #251 | Tragic 12.8% |
| French American Indians | 1.0 /100 | #252 | Tragic 12.7% |
| Immigrants | Dominica | 0.8 /100 | #253 | Tragic 12.6% |
| Indonesians | 0.8 /100 | #254 | Tragic 12.6% |
| Immigrants | Congo | 0.8 /100 | #255 | Tragic 12.6% |
| Immigrants | Portugal | 0.8 /100 | #256 | Tragic 12.6% |
| Osage | 0.7 /100 | #257 | Tragic 12.6% |
| Immigrants | Liberia | 0.6 /100 | #258 | Tragic 12.5% |
| Japanese | 0.6 /100 | #259 | Tragic 12.5% |
| Dominicans | 0.6 /100 | #260 | Tragic 12.5% |
| Tongans | 0.6 /100 | #261 | Tragic 12.5% |
| Nicaraguans | 0.6 /100 | #262 | Tragic 12.5% |
| Central American Indians | 0.5 /100 | #263 | Tragic 12.4% |
| Belizeans | 0.5 /100 | #264 | Tragic 12.4% |
Demographics Similar to Immigrants from Japan by Master's Degree
In terms of master's degree, the demographic groups most similar to Immigrants from Japan are Cambodian (20.0%, a difference of 0.10%), Immigrants from Sri Lanka (19.9%, a difference of 0.51%), Turkish (19.9%, a difference of 0.58%), Latvian (19.8%, a difference of 0.99%), and Immigrants from Sweden (20.3%, a difference of 1.3%).
| Demographics | Rating | Rank | Master's Degree |
| Soviet Union | 100.0 /100 | #18 | Exceptional 20.5% |
| Immigrants | Hong Kong | 100.0 /100 | #19 | Exceptional 20.5% |
| Indians (Asian) | 100.0 /100 | #20 | Exceptional 20.5% |
| Immigrants | Ireland | 100.0 /100 | #21 | Exceptional 20.4% |
| Israelis | 100.0 /100 | #22 | Exceptional 20.3% |
| Immigrants | France | 100.0 /100 | #23 | Exceptional 20.3% |
| Immigrants | Sweden | 100.0 /100 | #24 | Exceptional 20.3% |
| Immigrants | Japan | 100.0 /100 | #25 | Exceptional 20.0% |
| Cambodians | 100.0 /100 | #26 | Exceptional 20.0% |
| Immigrants | Sri Lanka | 100.0 /100 | #27 | Exceptional 19.9% |
| Turks | 100.0 /100 | #28 | Exceptional 19.9% |
| Latvians | 100.0 /100 | #29 | Exceptional 19.8% |
| Immigrants | Turkey | 100.0 /100 | #30 | Exceptional 19.7% |
| Immigrants | Korea | 100.0 /100 | #31 | Exceptional 19.7% |
| Burmese | 100.0 /100 | #32 | Exceptional 19.7% |