Osage vs Hungarian Master's Degree
COMPARE
Osage
Hungarian
Master's Degree
Master's Degree Comparison
Osage
Hungarians
12.6%
MASTER'S DEGREE
0.7/ 100
METRIC RATING
257th/ 347
METRIC RANK
15.6%
MASTER'S DEGREE
79.1/ 100
METRIC RATING
147th/ 347
METRIC RANK
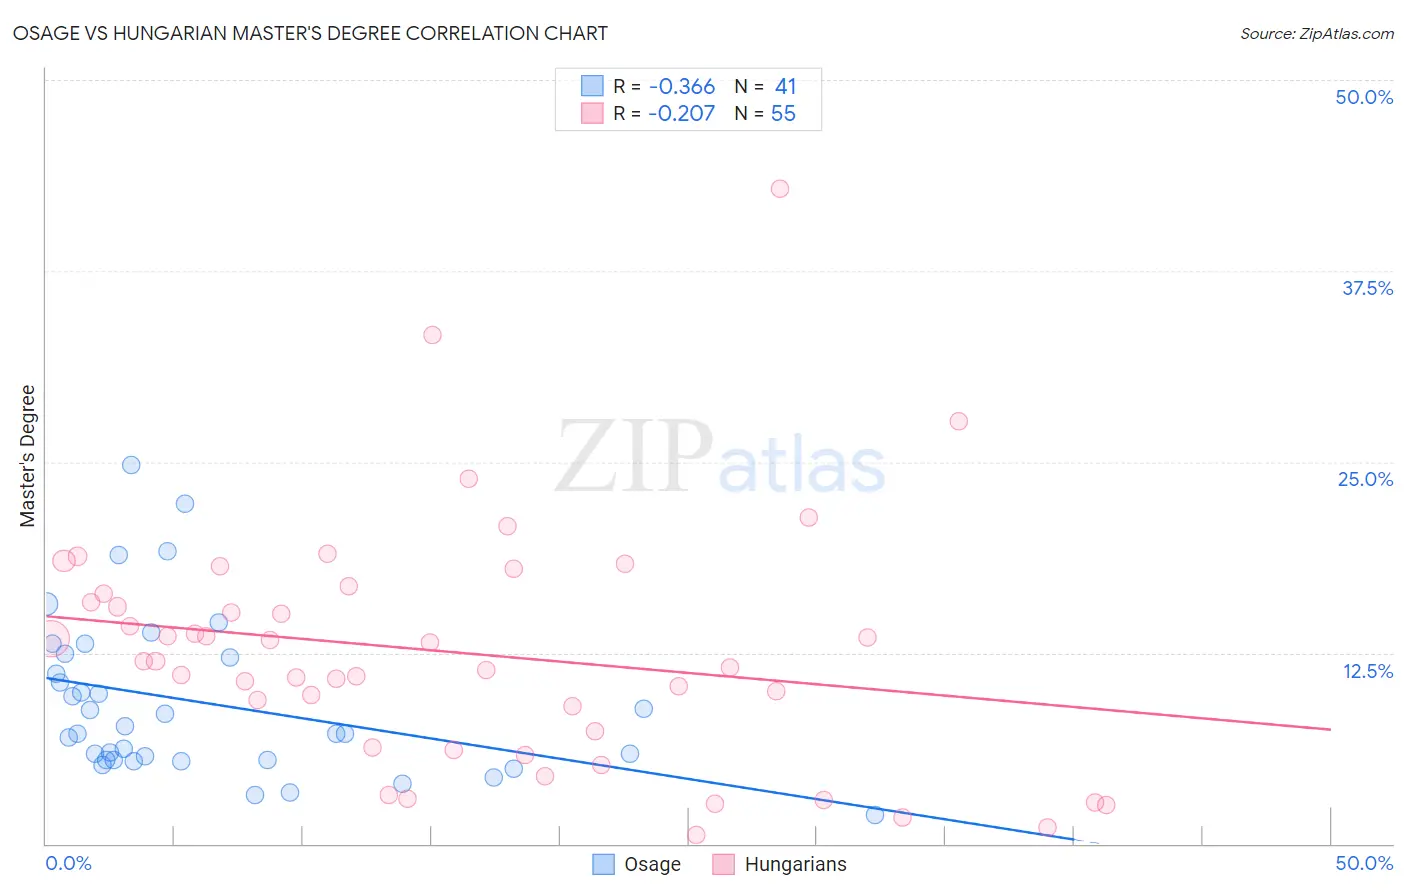
Osage vs Hungarian Master's Degree Correlation Chart
The statistical analysis conducted on geographies consisting of 91,790,824 people shows a mild negative correlation between the proportion of Osage and percentage of population with at least master's degree education in the United States with a correlation coefficient (R) of -0.366 and weighted average of 12.6%. Similarly, the statistical analysis conducted on geographies consisting of 485,986,149 people shows a weak negative correlation between the proportion of Hungarians and percentage of population with at least master's degree education in the United States with a correlation coefficient (R) of -0.207 and weighted average of 15.6%, a difference of 23.8%.
Master's Degree Correlation Summary
| Measurement | Osage | Hungarian |
| Minimum | 1.9% | 0.58% |
| Maximum | 24.8% | 42.9% |
| Range | 22.9% | 42.3% |
| Mean | 9.2% | 12.5% |
| Median | 7.2% | 11.9% |
| Interquartile 25% (IQ1) | 5.5% | 6.3% |
| Interquartile 75% (IQ3) | 12.3% | 16.4% |
| Interquartile Range (IQR) | 6.9% | 10.1% |
| Standard Deviation (Sample) | 5.3% | 8.0% |
| Standard Deviation (Population) | 5.2% | 7.9% |
Similar Demographics by Master's Degree
Demographics Similar to Osage by Master's Degree
In terms of master's degree, the demographic groups most similar to Osage are Immigrants from Portugal (12.6%, a difference of 0.48%), Immigrants from Liberia (12.5%, a difference of 0.50%), Immigrants from Congo (12.6%, a difference of 0.55%), Indonesian (12.6%, a difference of 0.58%), and Japanese (12.5%, a difference of 0.59%).
| Demographics | Rating | Rank | Master's Degree |
| Liberians | 1.3 /100 | #250 | Tragic 12.8% |
| Tlingit-Haida | 1.3 /100 | #251 | Tragic 12.8% |
| French American Indians | 1.0 /100 | #252 | Tragic 12.7% |
| Immigrants | Dominica | 0.8 /100 | #253 | Tragic 12.6% |
| Indonesians | 0.8 /100 | #254 | Tragic 12.6% |
| Immigrants | Congo | 0.8 /100 | #255 | Tragic 12.6% |
| Immigrants | Portugal | 0.8 /100 | #256 | Tragic 12.6% |
| Osage | 0.7 /100 | #257 | Tragic 12.6% |
| Immigrants | Liberia | 0.6 /100 | #258 | Tragic 12.5% |
| Japanese | 0.6 /100 | #259 | Tragic 12.5% |
| Dominicans | 0.6 /100 | #260 | Tragic 12.5% |
| Tongans | 0.6 /100 | #261 | Tragic 12.5% |
| Nicaraguans | 0.6 /100 | #262 | Tragic 12.5% |
| Central American Indians | 0.5 /100 | #263 | Tragic 12.4% |
| Belizeans | 0.5 /100 | #264 | Tragic 12.4% |
Demographics Similar to Hungarians by Master's Degree
In terms of master's degree, the demographic groups most similar to Hungarians are Immigrants from Afghanistan (15.6%, a difference of 0.040%), Immigrants from Senegal (15.5%, a difference of 0.17%), Ghanaian (15.5%, a difference of 0.18%), Slovene (15.5%, a difference of 0.21%), and Iraqi (15.5%, a difference of 0.33%).
| Demographics | Rating | Rank | Master's Degree |
| Vietnamese | 85.5 /100 | #140 | Excellent 15.8% |
| Poles | 85.0 /100 | #141 | Excellent 15.7% |
| Immigrants | Africa | 84.0 /100 | #142 | Excellent 15.7% |
| Immigrants | Venezuela | 83.6 /100 | #143 | Excellent 15.7% |
| Canadians | 83.3 /100 | #144 | Excellent 15.7% |
| South Americans | 81.3 /100 | #145 | Excellent 15.6% |
| Immigrants | Afghanistan | 79.4 /100 | #146 | Good 15.6% |
| Hungarians | 79.1 /100 | #147 | Good 15.6% |
| Immigrants | Senegal | 78.2 /100 | #148 | Good 15.5% |
| Ghanaians | 78.2 /100 | #149 | Good 15.5% |
| Slovenes | 78.0 /100 | #150 | Good 15.5% |
| Iraqis | 77.3 /100 | #151 | Good 15.5% |
| Slavs | 77.0 /100 | #152 | Good 15.5% |
| Icelanders | 76.8 /100 | #153 | Good 15.5% |
| Immigrants | South America | 76.3 /100 | #154 | Good 15.5% |