Osage vs Yugoslavian Kindergarten
COMPARE
Osage
Yugoslavian
Kindergarten
Kindergarten Comparison
Osage
Yugoslavians
98.3%
KINDERGARTEN
99.1/ 100
METRIC RATING
83rd/ 347
METRIC RANK
98.2%
KINDERGARTEN
95.5/ 100
METRIC RATING
118th/ 347
METRIC RANK
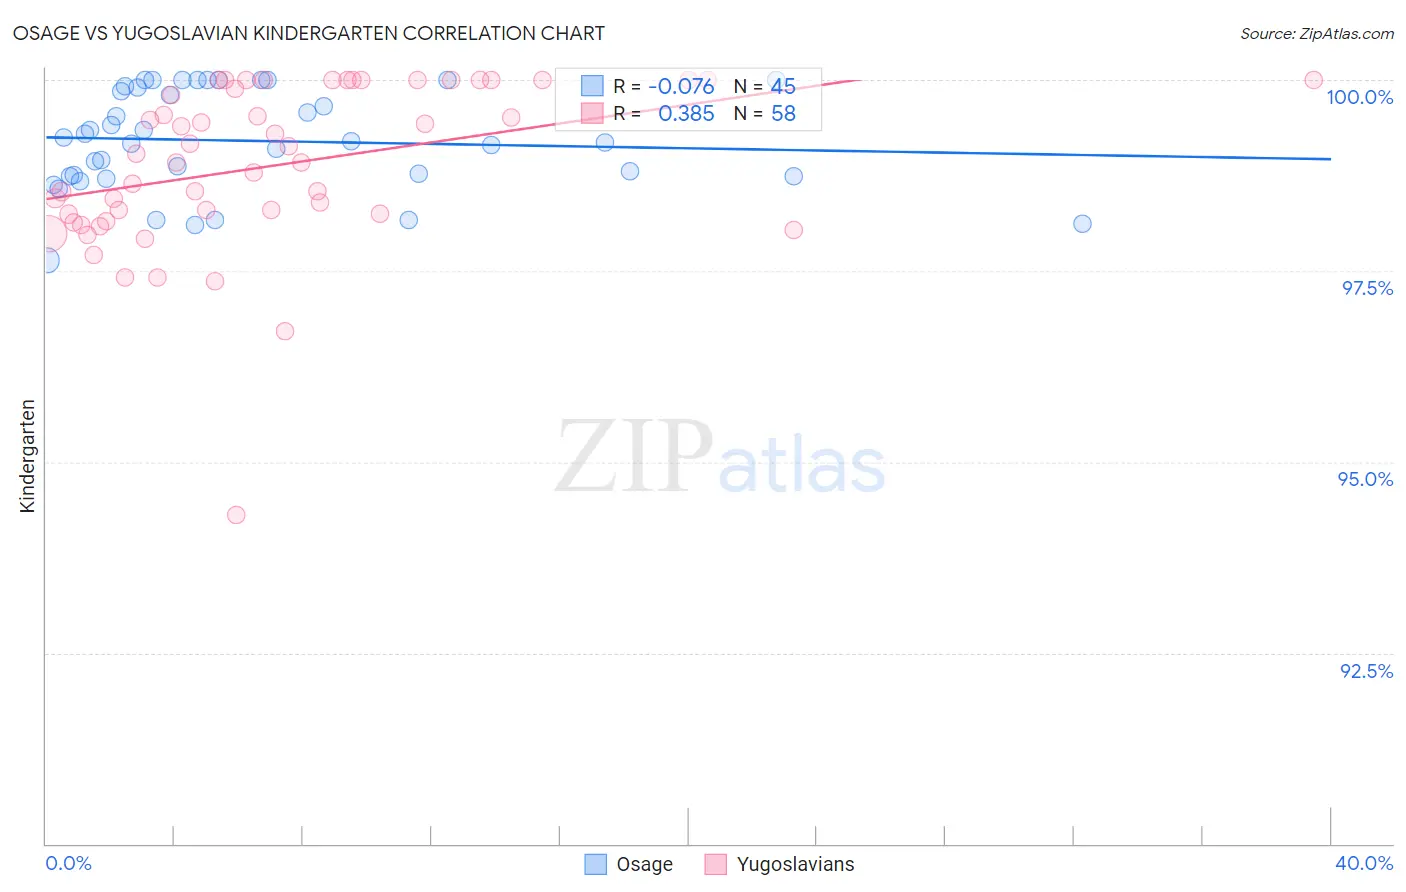
Osage vs Yugoslavian Kindergarten Correlation Chart
The statistical analysis conducted on geographies consisting of 91,808,929 people shows a slight negative correlation between the proportion of Osage and percentage of population with at least kindergarten education in the United States with a correlation coefficient (R) of -0.076 and weighted average of 98.3%. Similarly, the statistical analysis conducted on geographies consisting of 285,681,276 people shows a mild positive correlation between the proportion of Yugoslavians and percentage of population with at least kindergarten education in the United States with a correlation coefficient (R) of 0.385 and weighted average of 98.2%, a difference of 0.13%.
Kindergarten Correlation Summary
| Measurement | Osage | Yugoslavian |
| Minimum | 97.6% | 94.3% |
| Maximum | 100.0% | 100.0% |
| Range | 2.4% | 5.7% |
| Mean | 99.2% | 98.9% |
| Median | 99.2% | 99.0% |
| Interquartile 25% (IQ1) | 98.7% | 98.2% |
| Interquartile 75% (IQ3) | 99.9% | 100.0% |
| Interquartile Range (IQR) | 1.2% | 1.8% |
| Standard Deviation (Sample) | 0.66% | 1.1% |
| Standard Deviation (Population) | 0.65% | 1.1% |
Similar Demographics by Kindergarten
Demographics Similar to Osage by Kindergarten
In terms of kindergarten, the demographic groups most similar to Osage are Icelander (98.3%, a difference of 0.0%), Potawatomi (98.3%, a difference of 0.0%), Immigrants from England (98.3%, a difference of 0.010%), Delaware (98.3%, a difference of 0.010%), and Shoshone (98.3%, a difference of 0.010%).
| Demographics | Rating | Rank | Kindergarten |
| Immigrants | England | 99.3 /100 | #76 | Exceptional 98.3% |
| Delaware | 99.3 /100 | #77 | Exceptional 98.3% |
| Shoshone | 99.2 /100 | #78 | Exceptional 98.3% |
| Immigrants | Belgium | 99.2 /100 | #79 | Exceptional 98.3% |
| Immigrants | Lithuania | 99.2 /100 | #80 | Exceptional 98.3% |
| Icelanders | 99.2 /100 | #81 | Exceptional 98.3% |
| Potawatomi | 99.2 /100 | #82 | Exceptional 98.3% |
| Osage | 99.1 /100 | #83 | Exceptional 98.3% |
| Immigrants | Denmark | 99.1 /100 | #84 | Exceptional 98.3% |
| Immigrants | Sweden | 99.1 /100 | #85 | Exceptional 98.3% |
| Hopi | 99.0 /100 | #86 | Exceptional 98.3% |
| Immigrants | Australia | 99.0 /100 | #87 | Exceptional 98.3% |
| Ukrainians | 98.8 /100 | #88 | Exceptional 98.3% |
| Immigrants | South Africa | 98.8 /100 | #89 | Exceptional 98.3% |
| Zimbabweans | 98.8 /100 | #90 | Exceptional 98.3% |
Demographics Similar to Yugoslavians by Kindergarten
In terms of kindergarten, the demographic groups most similar to Yugoslavians are Immigrants from France (98.2%, a difference of 0.0%), Iranian (98.2%, a difference of 0.010%), Spanish (98.2%, a difference of 0.010%), Thai (98.2%, a difference of 0.010%), and Immigrants from Norway (98.2%, a difference of 0.020%).
| Demographics | Rating | Rank | Kindergarten |
| Immigrants | Norway | 96.6 /100 | #111 | Exceptional 98.2% |
| Immigrants | Czechoslovakia | 96.6 /100 | #112 | Exceptional 98.2% |
| Immigrants | Latvia | 96.3 /100 | #113 | Exceptional 98.2% |
| Ute | 96.3 /100 | #114 | Exceptional 98.2% |
| Iranians | 96.2 /100 | #115 | Exceptional 98.2% |
| Spanish | 95.8 /100 | #116 | Exceptional 98.2% |
| Immigrants | France | 95.5 /100 | #117 | Exceptional 98.2% |
| Yugoslavians | 95.5 /100 | #118 | Exceptional 98.2% |
| Thais | 94.8 /100 | #119 | Exceptional 98.2% |
| Okinawans | 94.4 /100 | #120 | Exceptional 98.2% |
| Immigrants | Zimbabwe | 94.0 /100 | #121 | Exceptional 98.2% |
| Immigrants | Japan | 94.0 /100 | #122 | Exceptional 98.2% |
| Menominee | 93.9 /100 | #123 | Exceptional 98.2% |
| Syrians | 93.6 /100 | #124 | Exceptional 98.2% |
| Iroquois | 93.5 /100 | #125 | Exceptional 98.2% |