Osage vs Immigrants from Bolivia Associate's Degree
COMPARE
Osage
Immigrants from Bolivia
Associate's Degree
Associate's Degree Comparison
Osage
Immigrants from Bolivia
41.5%
ASSOCIATE'S DEGREE
0.3/ 100
METRIC RATING
264th/ 347
METRIC RANK
51.5%
ASSOCIATE'S DEGREE
99.7/ 100
METRIC RATING
60th/ 347
METRIC RANK
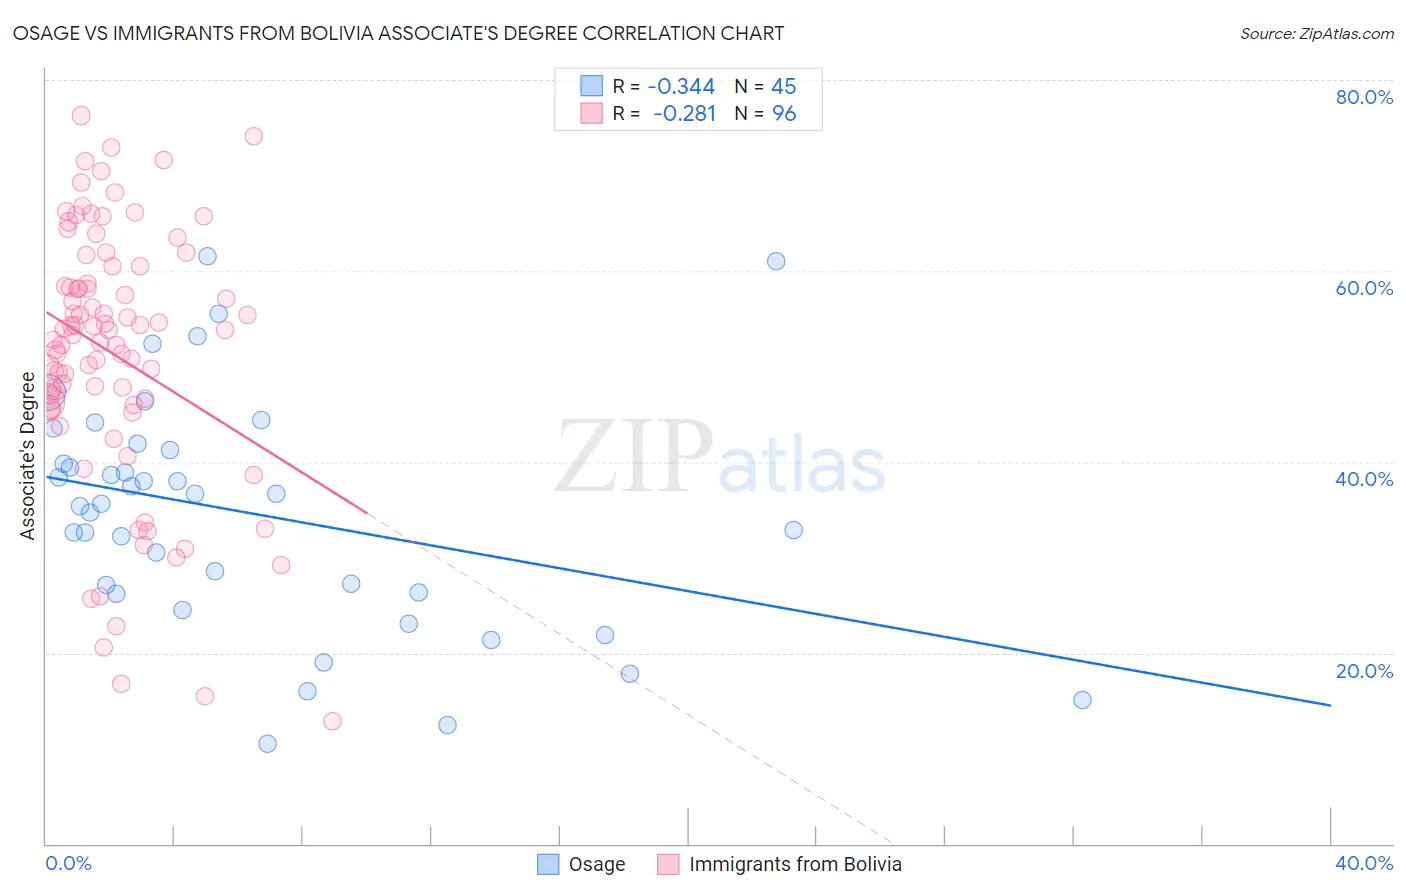
Osage vs Immigrants from Bolivia Associate's Degree Correlation Chart
The statistical analysis conducted on geographies consisting of 91,808,929 people shows a mild negative correlation between the proportion of Osage and percentage of population with at least associate's degree education in the United States with a correlation coefficient (R) of -0.344 and weighted average of 41.5%. Similarly, the statistical analysis conducted on geographies consisting of 158,730,512 people shows a weak negative correlation between the proportion of Immigrants from Bolivia and percentage of population with at least associate's degree education in the United States with a correlation coefficient (R) of -0.281 and weighted average of 51.5%, a difference of 24.2%.
Associate's Degree Correlation Summary
| Measurement | Osage | Immigrants from Bolivia |
| Minimum | 10.4% | 12.9% |
| Maximum | 61.5% | 76.3% |
| Range | 51.1% | 63.4% |
| Mean | 34.6% | 51.2% |
| Median | 35.6% | 53.5% |
| Interquartile 25% (IQ1) | 26.3% | 46.1% |
| Interquartile 75% (IQ3) | 41.5% | 59.5% |
| Interquartile Range (IQR) | 15.3% | 13.4% |
| Standard Deviation (Sample) | 12.2% | 13.6% |
| Standard Deviation (Population) | 12.1% | 13.6% |
Similar Demographics by Associate's Degree
Demographics Similar to Osage by Associate's Degree
In terms of associate's degree, the demographic groups most similar to Osage are Immigrants from Jamaica (41.5%, a difference of 0.010%), Bahamian (41.5%, a difference of 0.030%), Nicaraguan (41.5%, a difference of 0.12%), Marshallese (41.6%, a difference of 0.25%), and Malaysian (41.6%, a difference of 0.44%).
| Demographics | Rating | Rank | Associate's Degree |
| Spanish Americans | 0.5 /100 | #257 | Tragic 41.8% |
| Japanese | 0.5 /100 | #258 | Tragic 41.7% |
| Malaysians | 0.4 /100 | #259 | Tragic 41.6% |
| Marshallese | 0.4 /100 | #260 | Tragic 41.6% |
| Nicaraguans | 0.4 /100 | #261 | Tragic 41.5% |
| Bahamians | 0.4 /100 | #262 | Tragic 41.5% |
| Immigrants | Jamaica | 0.3 /100 | #263 | Tragic 41.5% |
| Osage | 0.3 /100 | #264 | Tragic 41.5% |
| Africans | 0.2 /100 | #265 | Tragic 41.1% |
| Samoans | 0.2 /100 | #266 | Tragic 41.1% |
| Hawaiians | 0.2 /100 | #267 | Tragic 40.9% |
| Central American Indians | 0.2 /100 | #268 | Tragic 40.8% |
| Americans | 0.2 /100 | #269 | Tragic 40.8% |
| Chippewa | 0.2 /100 | #270 | Tragic 40.7% |
| Immigrants | Laos | 0.1 /100 | #271 | Tragic 40.7% |
Demographics Similar to Immigrants from Bolivia by Associate's Degree
In terms of associate's degree, the demographic groups most similar to Immigrants from Bolivia are Immigrants from Kazakhstan (51.4%, a difference of 0.15%), Bhutanese (51.4%, a difference of 0.15%), South African (51.4%, a difference of 0.21%), Immigrants from Netherlands (51.4%, a difference of 0.28%), and Zimbabwean (51.3%, a difference of 0.31%).
| Demographics | Rating | Rank | Associate's Degree |
| Immigrants | Asia | 99.8 /100 | #53 | Exceptional 52.0% |
| Immigrants | Spain | 99.8 /100 | #54 | Exceptional 51.9% |
| Australians | 99.8 /100 | #55 | Exceptional 51.9% |
| Immigrants | Czechoslovakia | 99.8 /100 | #56 | Exceptional 51.9% |
| Paraguayans | 99.8 /100 | #57 | Exceptional 51.8% |
| New Zealanders | 99.8 /100 | #58 | Exceptional 51.8% |
| Immigrants | Serbia | 99.8 /100 | #59 | Exceptional 51.7% |
| Immigrants | Bolivia | 99.7 /100 | #60 | Exceptional 51.5% |
| Immigrants | Kazakhstan | 99.7 /100 | #61 | Exceptional 51.4% |
| Bhutanese | 99.7 /100 | #62 | Exceptional 51.4% |
| South Africans | 99.7 /100 | #63 | Exceptional 51.4% |
| Immigrants | Netherlands | 99.7 /100 | #64 | Exceptional 51.4% |
| Zimbabweans | 99.7 /100 | #65 | Exceptional 51.3% |
| Immigrants | Europe | 99.7 /100 | #66 | Exceptional 51.3% |
| Argentineans | 99.6 /100 | #67 | Exceptional 51.2% |