Immigrants from Serbia vs Immigrants from Zimbabwe College, Under 1 year
COMPARE
Immigrants from Serbia
Immigrants from Zimbabwe
College, Under 1 year
College, Under 1 year Comparison
Immigrants from Serbia
Immigrants from Zimbabwe
69.3%
COLLEGE, UNDER 1 YEAR
99.5/ 100
METRIC RATING
59th/ 347
METRIC RANK
68.9%
COLLEGE, UNDER 1 YEAR
99.2/ 100
METRIC RATING
67th/ 347
METRIC RANK
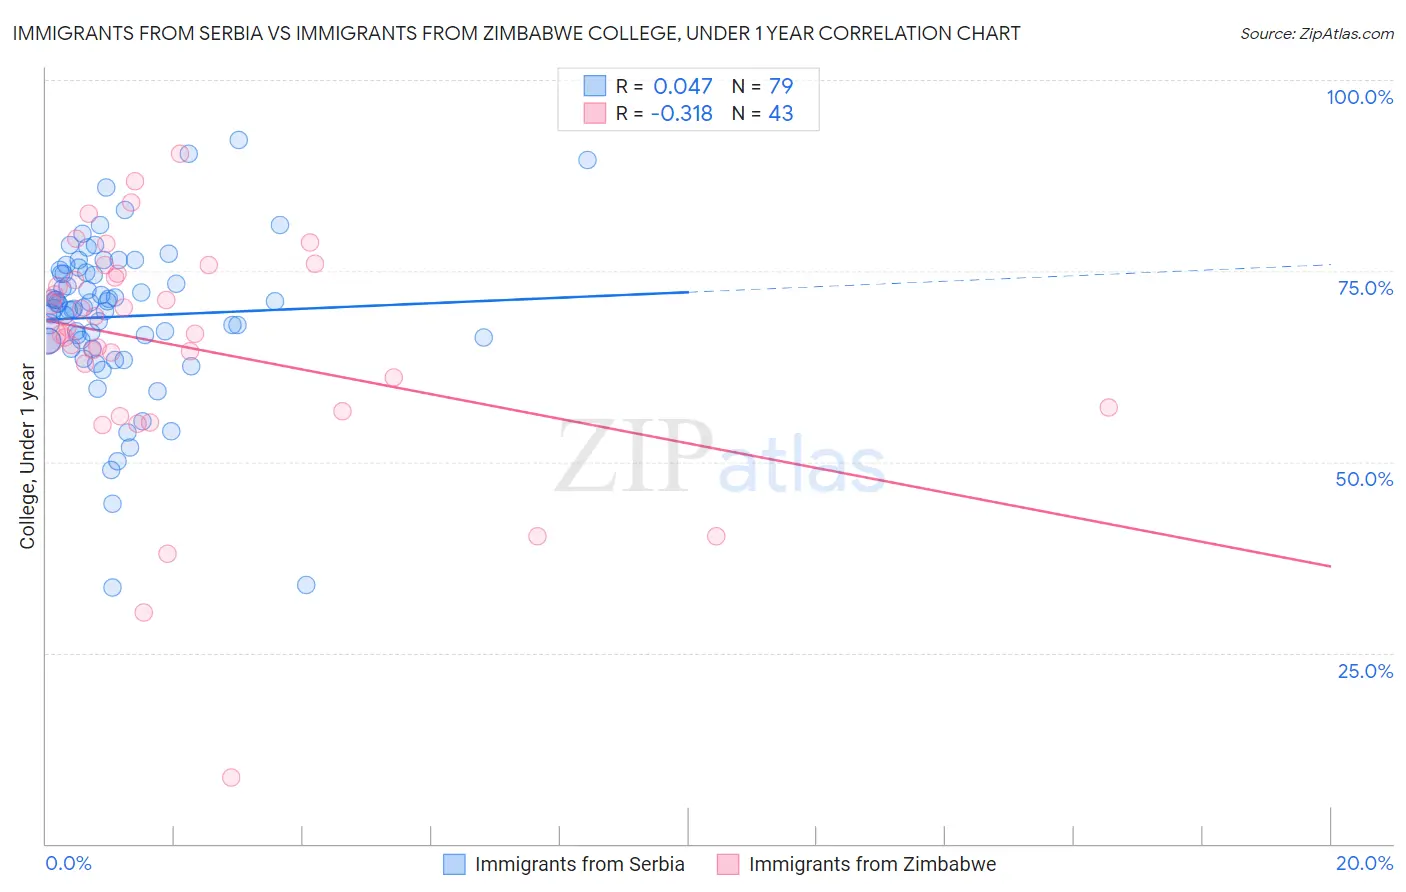
Immigrants from Serbia vs Immigrants from Zimbabwe College, Under 1 year Correlation Chart
The statistical analysis conducted on geographies consisting of 131,742,571 people shows no correlation between the proportion of Immigrants from Serbia and percentage of population with at least college, under 1 year education in the United States with a correlation coefficient (R) of 0.047 and weighted average of 69.3%. Similarly, the statistical analysis conducted on geographies consisting of 117,809,691 people shows a mild negative correlation between the proportion of Immigrants from Zimbabwe and percentage of population with at least college, under 1 year education in the United States with a correlation coefficient (R) of -0.318 and weighted average of 68.9%, a difference of 0.48%.
College, Under 1 year Correlation Summary
| Measurement | Immigrants from Serbia | Immigrants from Zimbabwe |
| Minimum | 33.6% | 8.7% |
| Maximum | 92.2% | 90.4% |
| Range | 58.6% | 81.8% |
| Mean | 69.0% | 65.1% |
| Median | 70.1% | 66.7% |
| Interquartile 25% (IQ1) | 65.8% | 57.1% |
| Interquartile 75% (IQ3) | 74.7% | 74.7% |
| Interquartile Range (IQR) | 8.9% | 17.5% |
| Standard Deviation (Sample) | 10.5% | 15.5% |
| Standard Deviation (Population) | 10.4% | 15.3% |
Demographics Similar to Immigrants from Serbia and Immigrants from Zimbabwe by College, Under 1 year
In terms of college, under 1 year, the demographic groups most similar to Immigrants from Serbia are Immigrants from Asia (69.2%, a difference of 0.090%), Immigrants from Malaysia (69.3%, a difference of 0.13%), Immigrants from Kazakhstan (69.2%, a difference of 0.13%), Immigrants from Belarus (69.2%, a difference of 0.13%), and Asian (69.4%, a difference of 0.23%). Similarly, the demographic groups most similar to Immigrants from Zimbabwe are Immigrants from Indonesia (68.9%, a difference of 0.030%), Immigrants from Romania (68.9%, a difference of 0.050%), Immigrants from North America (69.0%, a difference of 0.14%), Immigrants from Moldova (69.0%, a difference of 0.17%), and Northern European (69.0%, a difference of 0.18%).
| Demographics | Rating | Rank | College, Under 1 year |
| South Africans | 99.7 /100 | #53 | Exceptional 69.7% |
| Immigrants | Czechoslovakia | 99.7 /100 | #54 | Exceptional 69.6% |
| Maltese | 99.7 /100 | #55 | Exceptional 69.5% |
| Immigrants | Scotland | 99.6 /100 | #56 | Exceptional 69.4% |
| Asians | 99.6 /100 | #57 | Exceptional 69.4% |
| Immigrants | Malaysia | 99.6 /100 | #58 | Exceptional 69.3% |
| Immigrants | Serbia | 99.5 /100 | #59 | Exceptional 69.3% |
| Immigrants | Asia | 99.5 /100 | #60 | Exceptional 69.2% |
| Immigrants | Kazakhstan | 99.5 /100 | #61 | Exceptional 69.2% |
| Immigrants | Belarus | 99.5 /100 | #62 | Exceptional 69.2% |
| Immigrants | Canada | 99.4 /100 | #63 | Exceptional 69.1% |
| Northern Europeans | 99.4 /100 | #64 | Exceptional 69.0% |
| Immigrants | Moldova | 99.3 /100 | #65 | Exceptional 69.0% |
| Immigrants | North America | 99.3 /100 | #66 | Exceptional 69.0% |
| Immigrants | Zimbabwe | 99.2 /100 | #67 | Exceptional 68.9% |
| Immigrants | Indonesia | 99.2 /100 | #68 | Exceptional 68.9% |
| Immigrants | Romania | 99.2 /100 | #69 | Exceptional 68.9% |
| Lithuanians | 99.1 /100 | #70 | Exceptional 68.8% |
| Immigrants | Europe | 99.1 /100 | #71 | Exceptional 68.8% |
| Bolivians | 99.0 /100 | #72 | Exceptional 68.7% |
| Immigrants | England | 99.0 /100 | #73 | Exceptional 68.7% |