Immigrants from Senegal vs Immigrants from Zimbabwe College, Under 1 year
COMPARE
Immigrants from Senegal
Immigrants from Zimbabwe
College, Under 1 year
College, Under 1 year Comparison
Immigrants from Senegal
Immigrants from Zimbabwe
63.3%
COLLEGE, UNDER 1 YEAR
5.0/ 100
METRIC RATING
222nd/ 347
METRIC RANK
68.9%
COLLEGE, UNDER 1 YEAR
99.2/ 100
METRIC RATING
67th/ 347
METRIC RANK
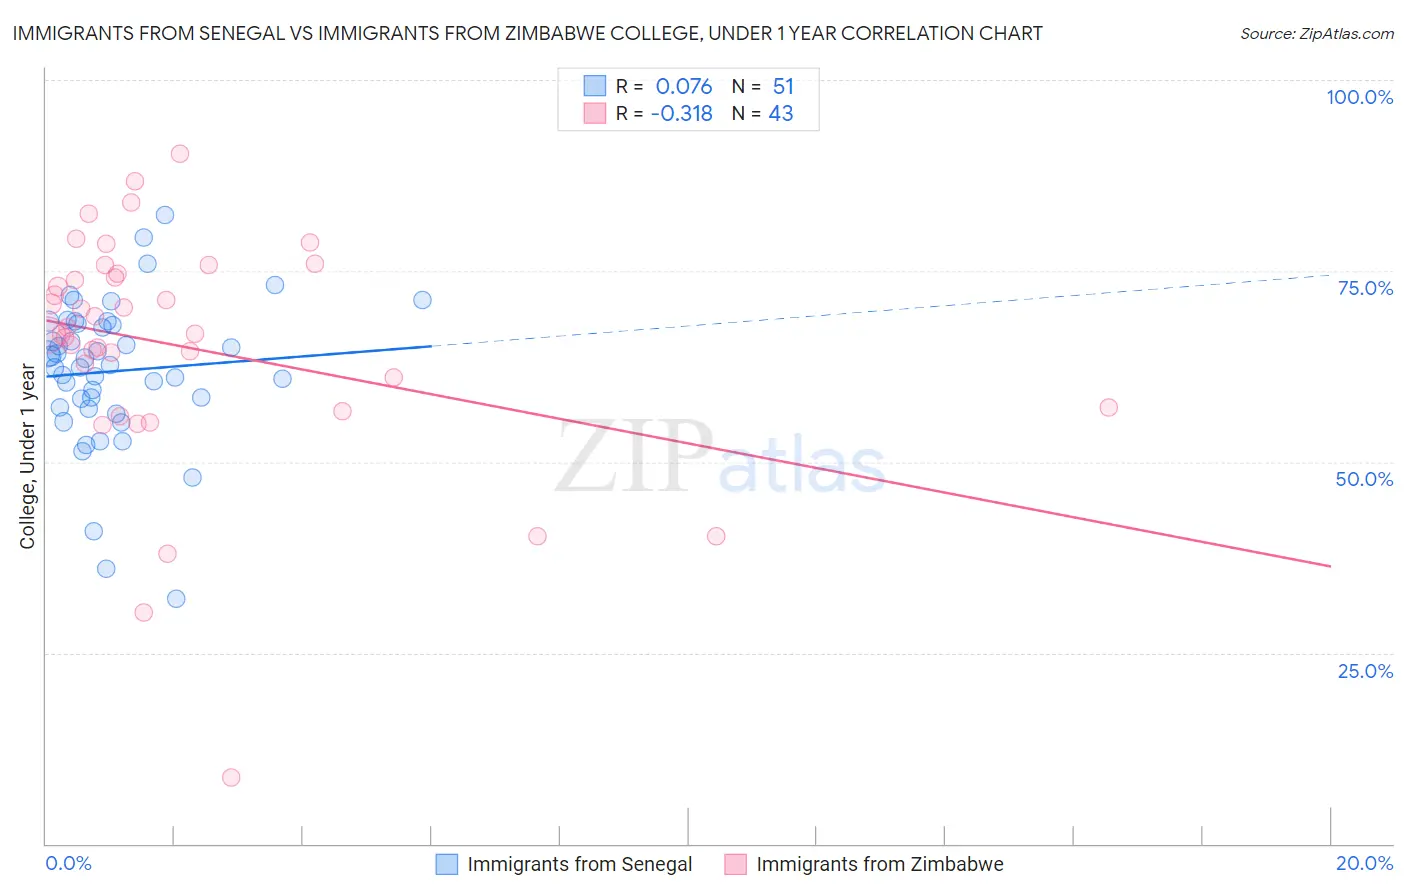
Immigrants from Senegal vs Immigrants from Zimbabwe College, Under 1 year Correlation Chart
The statistical analysis conducted on geographies consisting of 90,129,295 people shows a slight positive correlation between the proportion of Immigrants from Senegal and percentage of population with at least college, under 1 year education in the United States with a correlation coefficient (R) of 0.076 and weighted average of 63.3%. Similarly, the statistical analysis conducted on geographies consisting of 117,809,691 people shows a mild negative correlation between the proportion of Immigrants from Zimbabwe and percentage of population with at least college, under 1 year education in the United States with a correlation coefficient (R) of -0.318 and weighted average of 68.9%, a difference of 8.9%.
College, Under 1 year Correlation Summary
| Measurement | Immigrants from Senegal | Immigrants from Zimbabwe |
| Minimum | 32.1% | 8.7% |
| Maximum | 82.4% | 90.4% |
| Range | 50.2% | 81.8% |
| Mean | 61.9% | 65.1% |
| Median | 62.6% | 66.7% |
| Interquartile 25% (IQ1) | 57.1% | 57.1% |
| Interquartile 75% (IQ3) | 68.1% | 74.7% |
| Interquartile Range (IQR) | 11.0% | 17.5% |
| Standard Deviation (Sample) | 9.5% | 15.5% |
| Standard Deviation (Population) | 9.4% | 15.3% |
Similar Demographics by College, Under 1 year
Demographics Similar to Immigrants from Senegal by College, Under 1 year
In terms of college, under 1 year, the demographic groups most similar to Immigrants from Senegal are Cree (63.3%, a difference of 0.050%), Immigrants from Costa Rica (63.2%, a difference of 0.12%), Portuguese (63.4%, a difference of 0.14%), Subsaharan African (63.2%, a difference of 0.15%), and Immigrants from Panama (63.4%, a difference of 0.16%).
| Demographics | Rating | Rank | College, Under 1 year |
| Senegalese | 7.7 /100 | #215 | Tragic 63.6% |
| Hmong | 6.8 /100 | #216 | Tragic 63.5% |
| Immigrants | Uruguay | 5.8 /100 | #217 | Tragic 63.4% |
| Immigrants | Panama | 5.7 /100 | #218 | Tragic 63.4% |
| Immigrants | Fiji | 5.7 /100 | #219 | Tragic 63.4% |
| Portuguese | 5.6 /100 | #220 | Tragic 63.4% |
| Cree | 5.2 /100 | #221 | Tragic 63.3% |
| Immigrants | Senegal | 5.0 /100 | #222 | Tragic 63.3% |
| Immigrants | Costa Rica | 4.5 /100 | #223 | Tragic 63.2% |
| Sub-Saharan Africans | 4.4 /100 | #224 | Tragic 63.2% |
| Immigrants | Peru | 4.0 /100 | #225 | Tragic 63.1% |
| Immigrants | Colombia | 4.0 /100 | #226 | Tragic 63.1% |
| Immigrants | Ghana | 3.7 /100 | #227 | Tragic 63.1% |
| Samoans | 3.3 /100 | #228 | Tragic 63.0% |
| Liberians | 3.2 /100 | #229 | Tragic 63.0% |
Demographics Similar to Immigrants from Zimbabwe by College, Under 1 year
In terms of college, under 1 year, the demographic groups most similar to Immigrants from Zimbabwe are Immigrants from Indonesia (68.9%, a difference of 0.030%), Immigrants from Romania (68.9%, a difference of 0.050%), Immigrants from North America (69.0%, a difference of 0.14%), Immigrants from Moldova (69.0%, a difference of 0.17%), and Northern European (69.0%, a difference of 0.18%).
| Demographics | Rating | Rank | College, Under 1 year |
| Immigrants | Asia | 99.5 /100 | #60 | Exceptional 69.2% |
| Immigrants | Kazakhstan | 99.5 /100 | #61 | Exceptional 69.2% |
| Immigrants | Belarus | 99.5 /100 | #62 | Exceptional 69.2% |
| Immigrants | Canada | 99.4 /100 | #63 | Exceptional 69.1% |
| Northern Europeans | 99.4 /100 | #64 | Exceptional 69.0% |
| Immigrants | Moldova | 99.3 /100 | #65 | Exceptional 69.0% |
| Immigrants | North America | 99.3 /100 | #66 | Exceptional 69.0% |
| Immigrants | Zimbabwe | 99.2 /100 | #67 | Exceptional 68.9% |
| Immigrants | Indonesia | 99.2 /100 | #68 | Exceptional 68.9% |
| Immigrants | Romania | 99.2 /100 | #69 | Exceptional 68.9% |
| Lithuanians | 99.1 /100 | #70 | Exceptional 68.8% |
| Immigrants | Europe | 99.1 /100 | #71 | Exceptional 68.8% |
| Bolivians | 99.0 /100 | #72 | Exceptional 68.7% |
| Immigrants | England | 99.0 /100 | #73 | Exceptional 68.7% |
| Swedes | 98.9 /100 | #74 | Exceptional 68.7% |