Okinawan vs Native/Alaskan College, Under 1 year
COMPARE
Okinawan
Native/Alaskan
College, Under 1 year
College, Under 1 year Comparison
Okinawans
Natives/Alaskans
73.7%
COLLEGE, UNDER 1 YEAR
100.0/ 100
METRIC RATING
7th/ 347
METRIC RANK
56.6%
COLLEGE, UNDER 1 YEAR
0.0/ 100
METRIC RATING
321st/ 347
METRIC RANK
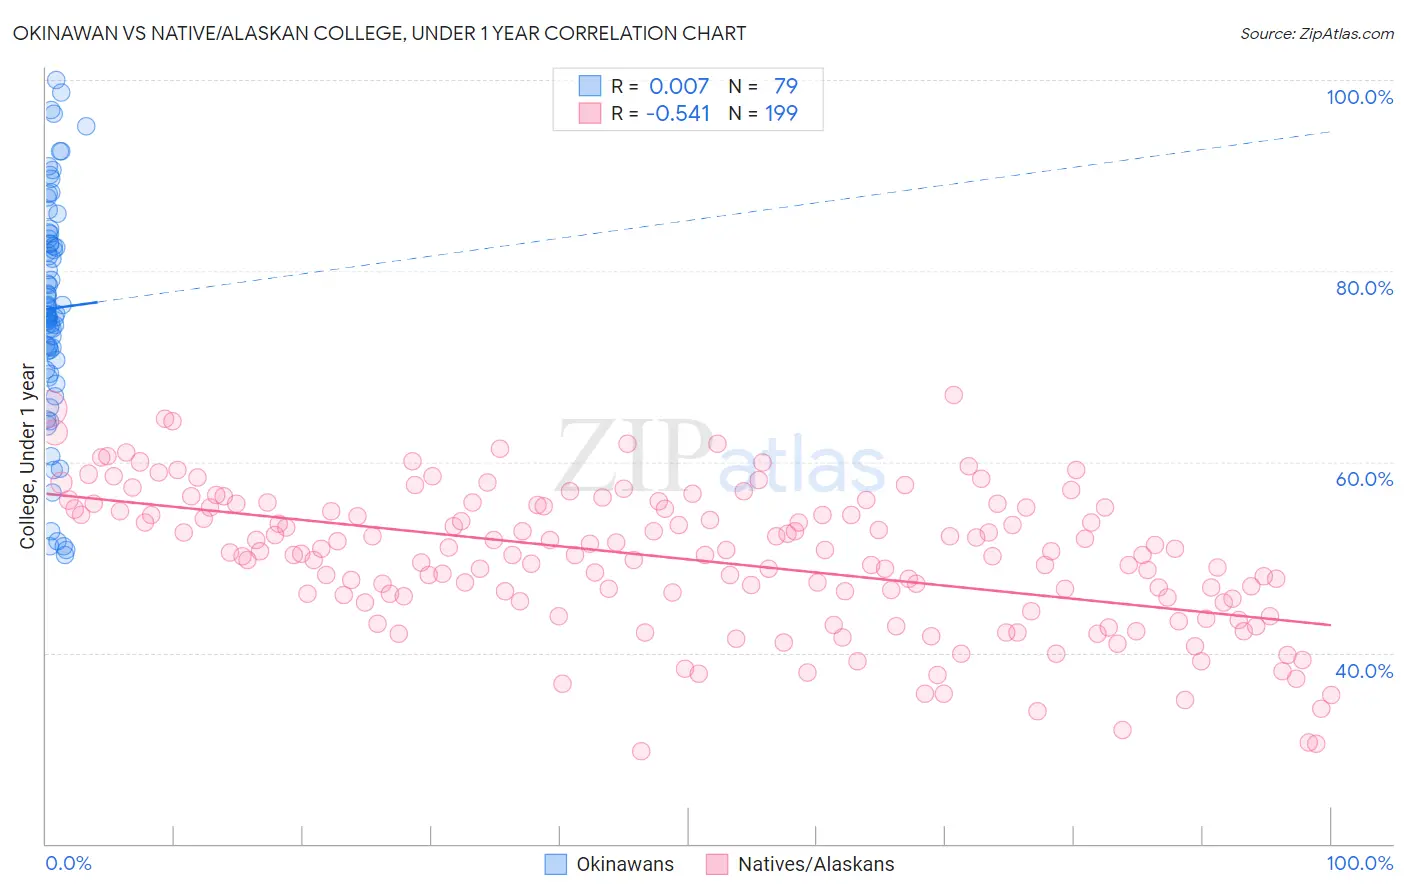
Okinawan vs Native/Alaskan College, Under 1 year Correlation Chart
The statistical analysis conducted on geographies consisting of 73,779,368 people shows no correlation between the proportion of Okinawans and percentage of population with at least college, under 1 year education in the United States with a correlation coefficient (R) of 0.007 and weighted average of 73.7%. Similarly, the statistical analysis conducted on geographies consisting of 513,071,269 people shows a substantial negative correlation between the proportion of Natives/Alaskans and percentage of population with at least college, under 1 year education in the United States with a correlation coefficient (R) of -0.541 and weighted average of 56.6%, a difference of 30.1%.
College, Under 1 year Correlation Summary
| Measurement | Okinawan | Native/Alaskan |
| Minimum | 50.3% | 29.7% |
| Maximum | 100.0% | 67.0% |
| Range | 49.7% | 37.4% |
| Mean | 76.1% | 49.8% |
| Median | 75.5% | 50.4% |
| Interquartile 25% (IQ1) | 70.6% | 45.4% |
| Interquartile 75% (IQ3) | 83.3% | 55.2% |
| Interquartile Range (IQR) | 12.7% | 9.8% |
| Standard Deviation (Sample) | 11.7% | 7.4% |
| Standard Deviation (Population) | 11.7% | 7.4% |
Similar Demographics by College, Under 1 year
Demographics Similar to Okinawans by College, Under 1 year
In terms of college, under 1 year, the demographic groups most similar to Okinawans are Thai (73.4%, a difference of 0.33%), Immigrants from Taiwan (74.2%, a difference of 0.70%), Immigrants from Iran (74.3%, a difference of 0.80%), Immigrants from India (74.4%, a difference of 1.0%), and Immigrants from Australia (72.7%, a difference of 1.3%).
| Demographics | Rating | Rank | College, Under 1 year |
| Filipinos | 100.0 /100 | #1 | Exceptional 75.5% |
| Iranians | 100.0 /100 | #2 | Exceptional 74.9% |
| Immigrants | Singapore | 100.0 /100 | #3 | Exceptional 74.8% |
| Immigrants | India | 100.0 /100 | #4 | Exceptional 74.4% |
| Immigrants | Iran | 100.0 /100 | #5 | Exceptional 74.3% |
| Immigrants | Taiwan | 100.0 /100 | #6 | Exceptional 74.2% |
| Okinawans | 100.0 /100 | #7 | Exceptional 73.7% |
| Thais | 100.0 /100 | #8 | Exceptional 73.4% |
| Immigrants | Australia | 100.0 /100 | #9 | Exceptional 72.7% |
| Immigrants | Israel | 100.0 /100 | #10 | Exceptional 72.3% |
| Immigrants | South Central Asia | 100.0 /100 | #11 | Exceptional 72.1% |
| Immigrants | Sweden | 100.0 /100 | #12 | Exceptional 72.1% |
| Cypriots | 100.0 /100 | #13 | Exceptional 72.0% |
| Cambodians | 100.0 /100 | #14 | Exceptional 71.9% |
| Burmese | 100.0 /100 | #15 | Exceptional 71.9% |
Demographics Similar to Natives/Alaskans by College, Under 1 year
In terms of college, under 1 year, the demographic groups most similar to Natives/Alaskans are Immigrants from Caribbean (56.6%, a difference of 0.13%), Guatemalan (56.8%, a difference of 0.26%), Immigrants from Honduras (56.5%, a difference of 0.31%), Puerto Rican (56.8%, a difference of 0.32%), and Immigrants from El Salvador (56.4%, a difference of 0.44%).
| Demographics | Rating | Rank | College, Under 1 year |
| Hopi | 0.0 /100 | #314 | Tragic 57.1% |
| Hondurans | 0.0 /100 | #315 | Tragic 57.1% |
| Menominee | 0.0 /100 | #316 | Tragic 57.0% |
| Hispanics or Latinos | 0.0 /100 | #317 | Tragic 57.0% |
| Immigrants | Haiti | 0.0 /100 | #318 | Tragic 56.9% |
| Puerto Ricans | 0.0 /100 | #319 | Tragic 56.8% |
| Guatemalans | 0.0 /100 | #320 | Tragic 56.8% |
| Natives/Alaskans | 0.0 /100 | #321 | Tragic 56.6% |
| Immigrants | Caribbean | 0.0 /100 | #322 | Tragic 56.6% |
| Immigrants | Honduras | 0.0 /100 | #323 | Tragic 56.5% |
| Immigrants | El Salvador | 0.0 /100 | #324 | Tragic 56.4% |
| Immigrants | Latin America | 0.0 /100 | #325 | Tragic 56.3% |
| Navajo | 0.0 /100 | #326 | Tragic 56.3% |
| Immigrants | Guatemala | 0.0 /100 | #327 | Tragic 56.2% |
| Cape Verdeans | 0.0 /100 | #328 | Tragic 56.0% |