Norwegian vs Chilean Householder Income Under 25 years
COMPARE
Norwegian
Chilean
Householder Income Under 25 years
Householder Income Under 25 years Comparison
Norwegians
Chileans
$53,127
HOUSEHOLDER INCOME UNDER 25 YEARS
90.8/ 100
METRIC RATING
138th/ 347
METRIC RANK
$53,185
HOUSEHOLDER INCOME UNDER 25 YEARS
91.9/ 100
METRIC RATING
135th/ 347
METRIC RANK
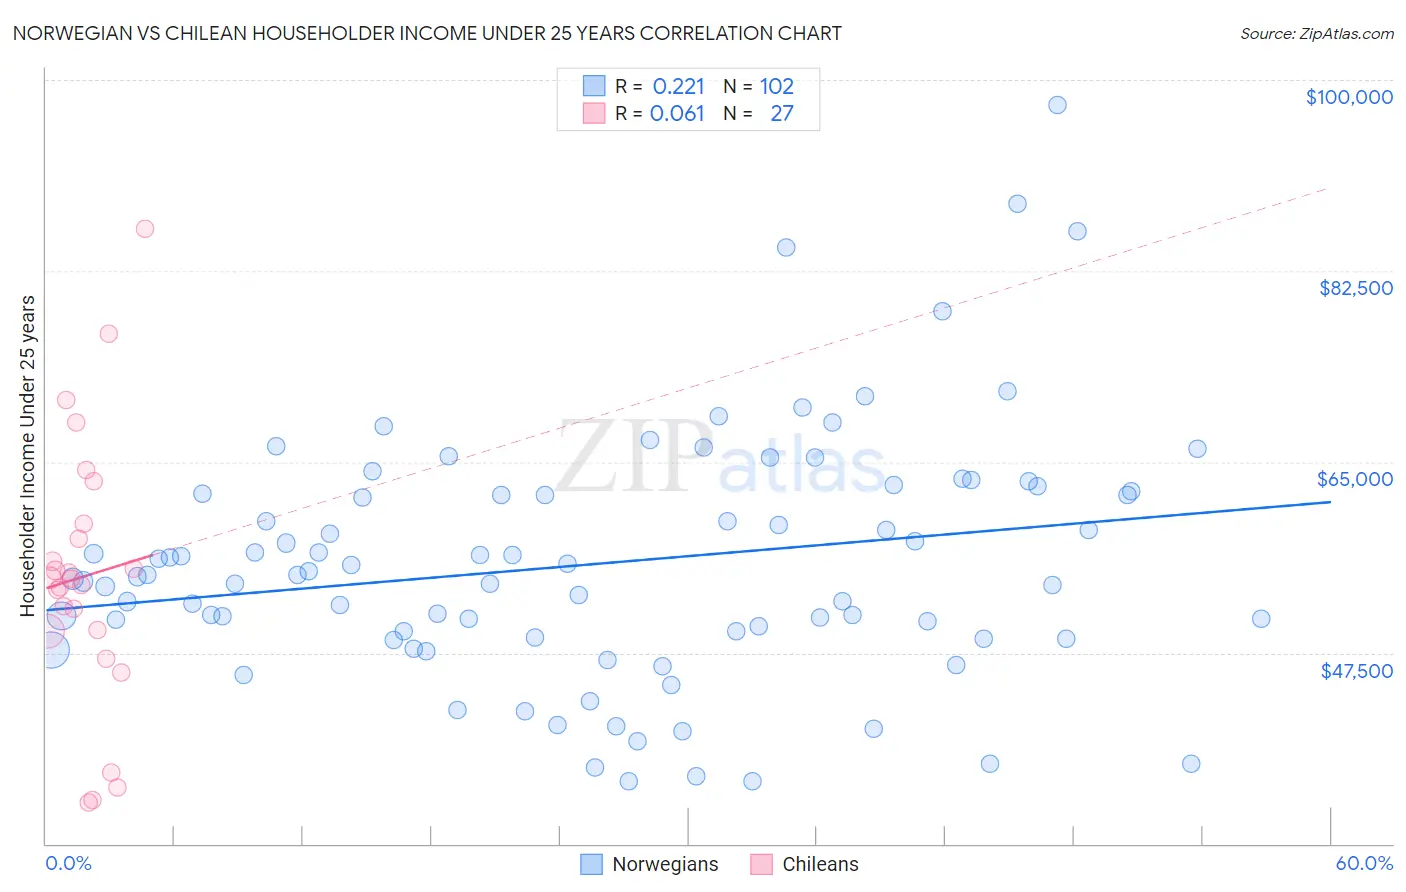
Norwegian vs Chilean Householder Income Under 25 years Correlation Chart
The statistical analysis conducted on geographies consisting of 421,100,375 people shows a weak positive correlation between the proportion of Norwegians and household income with householder under the age of 25 in the United States with a correlation coefficient (R) of 0.221 and weighted average of $53,127. Similarly, the statistical analysis conducted on geographies consisting of 225,371,987 people shows a slight positive correlation between the proportion of Chileans and household income with householder under the age of 25 in the United States with a correlation coefficient (R) of 0.061 and weighted average of $53,185, a difference of 0.11%.
Householder Income Under 25 years Correlation Summary
| Measurement | Norwegian | Chilean |
| Minimum | $35,753 | $33,789 |
| Maximum | $97,750 | $86,333 |
| Range | $61,997 | $52,544 |
| Mean | $55,657 | $54,520 |
| Median | $54,551 | $54,291 |
| Interquartile 25% (IQ1) | $48,924 | $49,428 |
| Interquartile 75% (IQ3) | $62,074 | $59,351 |
| Interquartile Range (IQR) | $13,150 | $9,923 |
| Standard Deviation (Sample) | $11,328 | $12,299 |
| Standard Deviation (Population) | $11,273 | $12,069 |
Demographics Similar to Norwegians and Chileans by Householder Income Under 25 years
In terms of householder income under 25 years, the demographic groups most similar to Norwegians are Costa Rican ($53,106, a difference of 0.040%), Immigrants from Barbados ($53,163, a difference of 0.070%), Hawaiian ($53,078, a difference of 0.090%), Armenian ($53,179, a difference of 0.10%), and Immigrants from Northern Africa ($53,185, a difference of 0.11%). Similarly, the demographic groups most similar to Chileans are Immigrants from Northern Africa ($53,185, a difference of 0.0%), Armenian ($53,179, a difference of 0.010%), Immigrants ($53,201, a difference of 0.030%), Immigrants from Barbados ($53,163, a difference of 0.040%), and Moroccan ($53,256, a difference of 0.13%).
| Demographics | Rating | Rank | Householder Income Under 25 years |
| Immigrants | Serbia | 94.1 /100 | #126 | Exceptional $53,321 |
| Immigrants | North America | 93.9 /100 | #127 | Exceptional $53,307 |
| Immigrants | Bulgaria | 93.9 /100 | #128 | Exceptional $53,305 |
| New Zealanders | 93.7 /100 | #129 | Exceptional $53,294 |
| Nicaraguans | 93.4 /100 | #130 | Exceptional $53,275 |
| Immigrants | Nicaragua | 93.3 /100 | #131 | Exceptional $53,266 |
| Moroccans | 93.1 /100 | #132 | Exceptional $53,256 |
| Immigrants | Immigrants | 92.2 /100 | #133 | Exceptional $53,201 |
| Immigrants | Northern Africa | 91.9 /100 | #134 | Exceptional $53,185 |
| Chileans | 91.9 /100 | #135 | Exceptional $53,185 |
| Armenians | 91.8 /100 | #136 | Exceptional $53,179 |
| Immigrants | Barbados | 91.5 /100 | #137 | Exceptional $53,163 |
| Norwegians | 90.8 /100 | #138 | Exceptional $53,127 |
| Costa Ricans | 90.4 /100 | #139 | Exceptional $53,106 |
| Hawaiians | 89.8 /100 | #140 | Excellent $53,078 |
| Danes | 88.9 /100 | #141 | Excellent $53,041 |
| Immigrants | Armenia | 87.5 /100 | #142 | Excellent $52,986 |
| Swedes | 87.5 /100 | #143 | Excellent $52,986 |
| South American Indians | 87.3 /100 | #144 | Excellent $52,979 |
| Immigrants | Western Europe | 86.7 /100 | #145 | Excellent $52,957 |
| Immigrants | Hungary | 81.6 /100 | #146 | Excellent $52,798 |