Norwegian vs Immigrants from Austria College, Under 1 year
COMPARE
Norwegian
Immigrants from Austria
College, Under 1 year
College, Under 1 year Comparison
Norwegians
Immigrants from Austria
68.4%
COLLEGE, UNDER 1 YEAR
98.4/ 100
METRIC RATING
82nd/ 347
METRIC RANK
70.0%
COLLEGE, UNDER 1 YEAR
99.8/ 100
METRIC RATING
49th/ 347
METRIC RANK
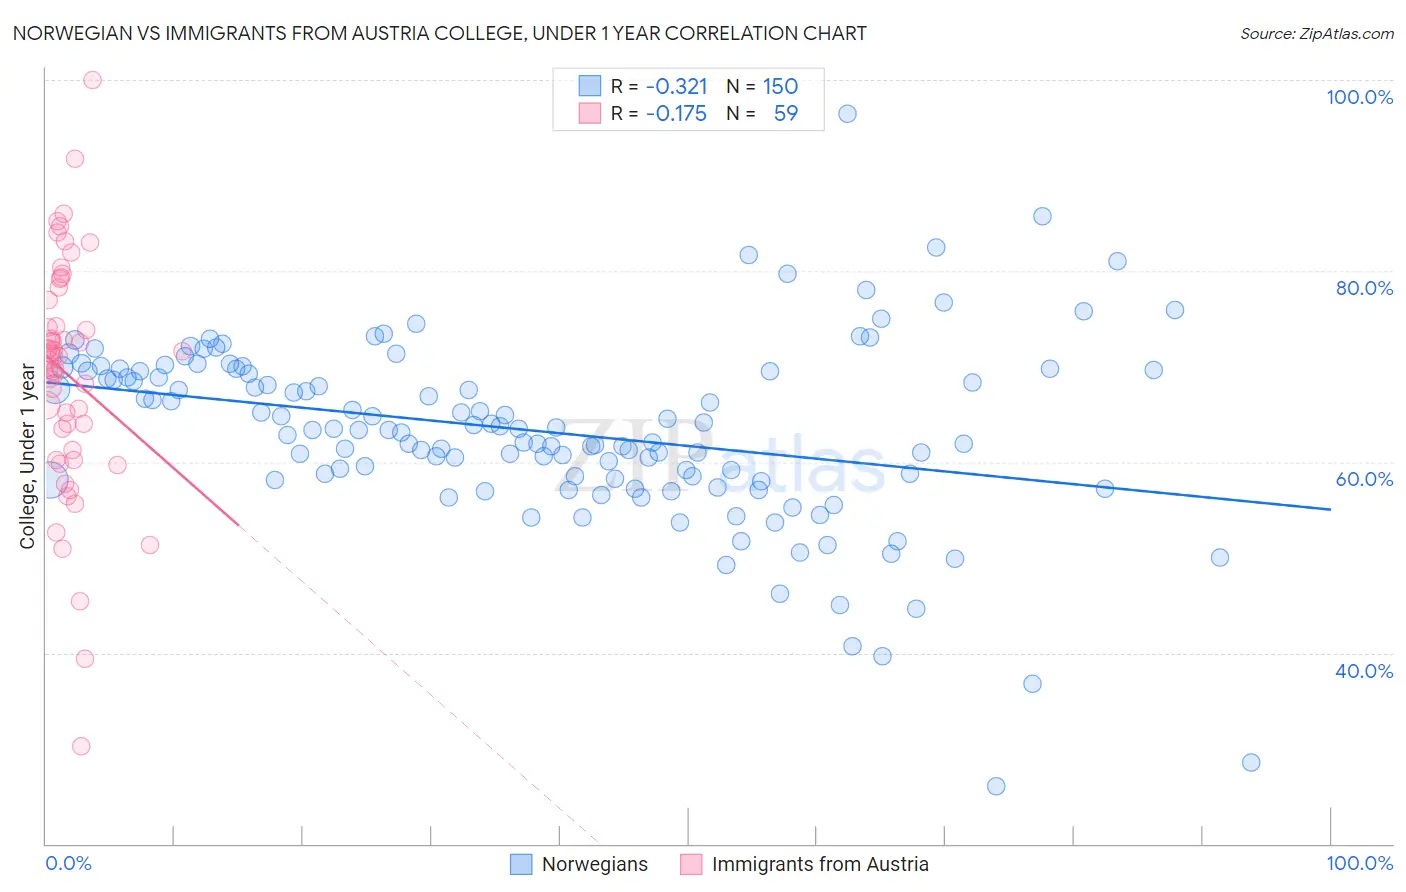
Norwegian vs Immigrants from Austria College, Under 1 year Correlation Chart
The statistical analysis conducted on geographies consisting of 533,391,768 people shows a mild negative correlation between the proportion of Norwegians and percentage of population with at least college, under 1 year education in the United States with a correlation coefficient (R) of -0.321 and weighted average of 68.4%. Similarly, the statistical analysis conducted on geographies consisting of 167,973,751 people shows a poor negative correlation between the proportion of Immigrants from Austria and percentage of population with at least college, under 1 year education in the United States with a correlation coefficient (R) of -0.175 and weighted average of 70.0%, a difference of 2.4%.
College, Under 1 year Correlation Summary
| Measurement | Norwegian | Immigrants from Austria |
| Minimum | 26.1% | 30.2% |
| Maximum | 96.4% | 100.0% |
| Range | 70.3% | 69.8% |
| Mean | 63.2% | 69.1% |
| Median | 63.4% | 71.0% |
| Interquartile 25% (IQ1) | 58.2% | 61.2% |
| Interquartile 75% (IQ3) | 69.6% | 76.9% |
| Interquartile Range (IQR) | 11.3% | 15.7% |
| Standard Deviation (Sample) | 9.7% | 12.3% |
| Standard Deviation (Population) | 9.7% | 12.2% |
Similar Demographics by College, Under 1 year
Demographics Similar to Norwegians by College, Under 1 year
In terms of college, under 1 year, the demographic groups most similar to Norwegians are Argentinean (68.4%, a difference of 0.020%), Immigrants from Hungary (68.3%, a difference of 0.040%), Egyptian (68.3%, a difference of 0.040%), Immigrants from Greece (68.4%, a difference of 0.050%), and Immigrants from Lebanon (68.3%, a difference of 0.050%).
| Demographics | Rating | Rank | College, Under 1 year |
| Immigrants | Western Europe | 98.6 /100 | #75 | Exceptional 68.5% |
| Laotians | 98.6 /100 | #76 | Exceptional 68.5% |
| British | 98.6 /100 | #77 | Exceptional 68.5% |
| Danes | 98.6 /100 | #78 | Exceptional 68.5% |
| Greeks | 98.6 /100 | #79 | Exceptional 68.5% |
| Immigrants | Spain | 98.5 /100 | #80 | Exceptional 68.4% |
| Immigrants | Greece | 98.5 /100 | #81 | Exceptional 68.4% |
| Norwegians | 98.4 /100 | #82 | Exceptional 68.4% |
| Argentineans | 98.4 /100 | #83 | Exceptional 68.4% |
| Immigrants | Hungary | 98.3 /100 | #84 | Exceptional 68.3% |
| Egyptians | 98.3 /100 | #85 | Exceptional 68.3% |
| Immigrants | Lebanon | 98.3 /100 | #86 | Exceptional 68.3% |
| Chinese | 98.3 /100 | #87 | Exceptional 68.3% |
| Croatians | 98.2 /100 | #88 | Exceptional 68.3% |
| Ethiopians | 98.2 /100 | #89 | Exceptional 68.3% |
Demographics Similar to Immigrants from Austria by College, Under 1 year
In terms of college, under 1 year, the demographic groups most similar to Immigrants from Austria are Immigrants from Netherlands (70.0%, a difference of 0.040%), Immigrants from Bulgaria (70.0%, a difference of 0.10%), Zimbabwean (69.9%, a difference of 0.12%), Mongolian (69.9%, a difference of 0.15%), and Immigrants from Russia (69.9%, a difference of 0.18%).
| Demographics | Rating | Rank | College, Under 1 year |
| Immigrants | Lithuania | 99.9 /100 | #42 | Exceptional 70.3% |
| Israelis | 99.9 /100 | #43 | Exceptional 70.2% |
| New Zealanders | 99.9 /100 | #44 | Exceptional 70.2% |
| Immigrants | Norway | 99.9 /100 | #45 | Exceptional 70.2% |
| Immigrants | Latvia | 99.9 /100 | #46 | Exceptional 70.1% |
| Immigrants | Bulgaria | 99.8 /100 | #47 | Exceptional 70.0% |
| Immigrants | Netherlands | 99.8 /100 | #48 | Exceptional 70.0% |
| Immigrants | Austria | 99.8 /100 | #49 | Exceptional 70.0% |
| Zimbabweans | 99.8 /100 | #50 | Exceptional 69.9% |
| Mongolians | 99.8 /100 | #51 | Exceptional 69.9% |
| Immigrants | Russia | 99.8 /100 | #52 | Exceptional 69.9% |
| South Africans | 99.7 /100 | #53 | Exceptional 69.7% |
| Immigrants | Czechoslovakia | 99.7 /100 | #54 | Exceptional 69.6% |
| Maltese | 99.7 /100 | #55 | Exceptional 69.5% |
| Immigrants | Scotland | 99.6 /100 | #56 | Exceptional 69.4% |