Norwegian vs Samoan College, Under 1 year
COMPARE
Norwegian
Samoan
College, Under 1 year
College, Under 1 year Comparison
Norwegians
Samoans
68.4%
COLLEGE, UNDER 1 YEAR
98.4/ 100
METRIC RATING
82nd/ 347
METRIC RANK
63.0%
COLLEGE, UNDER 1 YEAR
3.3/ 100
METRIC RATING
228th/ 347
METRIC RANK
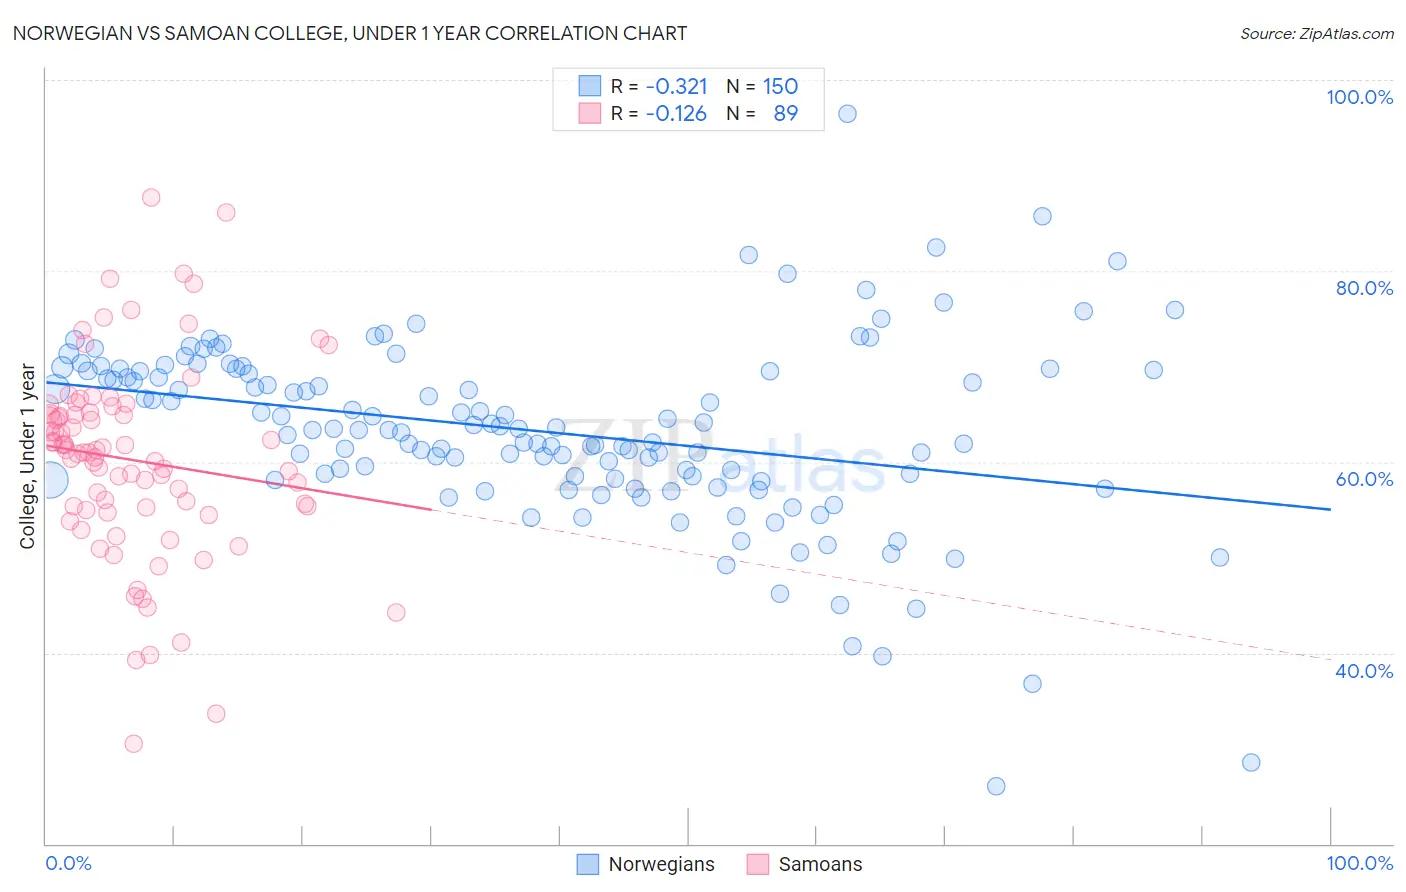
Norwegian vs Samoan College, Under 1 year Correlation Chart
The statistical analysis conducted on geographies consisting of 533,391,768 people shows a mild negative correlation between the proportion of Norwegians and percentage of population with at least college, under 1 year education in the United States with a correlation coefficient (R) of -0.321 and weighted average of 68.4%. Similarly, the statistical analysis conducted on geographies consisting of 225,205,919 people shows a poor negative correlation between the proportion of Samoans and percentage of population with at least college, under 1 year education in the United States with a correlation coefficient (R) of -0.126 and weighted average of 63.0%, a difference of 8.5%.
College, Under 1 year Correlation Summary
| Measurement | Norwegian | Samoan |
| Minimum | 26.1% | 30.5% |
| Maximum | 96.4% | 87.7% |
| Range | 70.3% | 57.2% |
| Mean | 63.2% | 60.2% |
| Median | 63.4% | 61.0% |
| Interquartile 25% (IQ1) | 58.2% | 55.1% |
| Interquartile 75% (IQ3) | 69.6% | 65.1% |
| Interquartile Range (IQR) | 11.3% | 10.0% |
| Standard Deviation (Sample) | 9.7% | 10.3% |
| Standard Deviation (Population) | 9.7% | 10.3% |
Similar Demographics by College, Under 1 year
Demographics Similar to Norwegians by College, Under 1 year
In terms of college, under 1 year, the demographic groups most similar to Norwegians are Argentinean (68.4%, a difference of 0.020%), Immigrants from Hungary (68.3%, a difference of 0.040%), Egyptian (68.3%, a difference of 0.040%), Immigrants from Greece (68.4%, a difference of 0.050%), and Immigrants from Lebanon (68.3%, a difference of 0.050%).
| Demographics | Rating | Rank | College, Under 1 year |
| Immigrants | Western Europe | 98.6 /100 | #75 | Exceptional 68.5% |
| Laotians | 98.6 /100 | #76 | Exceptional 68.5% |
| British | 98.6 /100 | #77 | Exceptional 68.5% |
| Danes | 98.6 /100 | #78 | Exceptional 68.5% |
| Greeks | 98.6 /100 | #79 | Exceptional 68.5% |
| Immigrants | Spain | 98.5 /100 | #80 | Exceptional 68.4% |
| Immigrants | Greece | 98.5 /100 | #81 | Exceptional 68.4% |
| Norwegians | 98.4 /100 | #82 | Exceptional 68.4% |
| Argentineans | 98.4 /100 | #83 | Exceptional 68.4% |
| Immigrants | Hungary | 98.3 /100 | #84 | Exceptional 68.3% |
| Egyptians | 98.3 /100 | #85 | Exceptional 68.3% |
| Immigrants | Lebanon | 98.3 /100 | #86 | Exceptional 68.3% |
| Chinese | 98.3 /100 | #87 | Exceptional 68.3% |
| Croatians | 98.2 /100 | #88 | Exceptional 68.3% |
| Ethiopians | 98.2 /100 | #89 | Exceptional 68.3% |
Demographics Similar to Samoans by College, Under 1 year
In terms of college, under 1 year, the demographic groups most similar to Samoans are Liberian (63.0%, a difference of 0.050%), Immigrants from Ghana (63.1%, a difference of 0.11%), Nonimmigrants (62.9%, a difference of 0.13%), Immigrants from Colombia (63.1%, a difference of 0.20%), and Immigrants from Peru (63.1%, a difference of 0.22%).
| Demographics | Rating | Rank | College, Under 1 year |
| Cree | 5.2 /100 | #221 | Tragic 63.3% |
| Immigrants | Senegal | 5.0 /100 | #222 | Tragic 63.3% |
| Immigrants | Costa Rica | 4.5 /100 | #223 | Tragic 63.2% |
| Sub-Saharan Africans | 4.4 /100 | #224 | Tragic 63.2% |
| Immigrants | Peru | 4.0 /100 | #225 | Tragic 63.1% |
| Immigrants | Colombia | 4.0 /100 | #226 | Tragic 63.1% |
| Immigrants | Ghana | 3.7 /100 | #227 | Tragic 63.1% |
| Samoans | 3.3 /100 | #228 | Tragic 63.0% |
| Liberians | 3.2 /100 | #229 | Tragic 63.0% |
| Immigrants | Nonimmigrants | 3.0 /100 | #230 | Tragic 62.9% |
| Immigrants | Western Africa | 2.4 /100 | #231 | Tragic 62.8% |
| Osage | 2.2 /100 | #232 | Tragic 62.7% |
| Iroquois | 2.0 /100 | #233 | Tragic 62.6% |
| Chippewa | 2.0 /100 | #234 | Tragic 62.6% |
| Spanish Americans | 1.9 /100 | #235 | Tragic 62.6% |