Nonimmigrants vs Puget Sound Salish 10th Grade
COMPARE
Nonimmigrants
Puget Sound Salish
10th Grade
10th Grade Comparison
Nonimmigrants
Puget Sound Salish
94.1%
10TH GRADE
83.8/ 100
METRIC RATING
145th/ 347
METRIC RANK
94.7%
10TH GRADE
99.0/ 100
METRIC RATING
86th/ 347
METRIC RANK
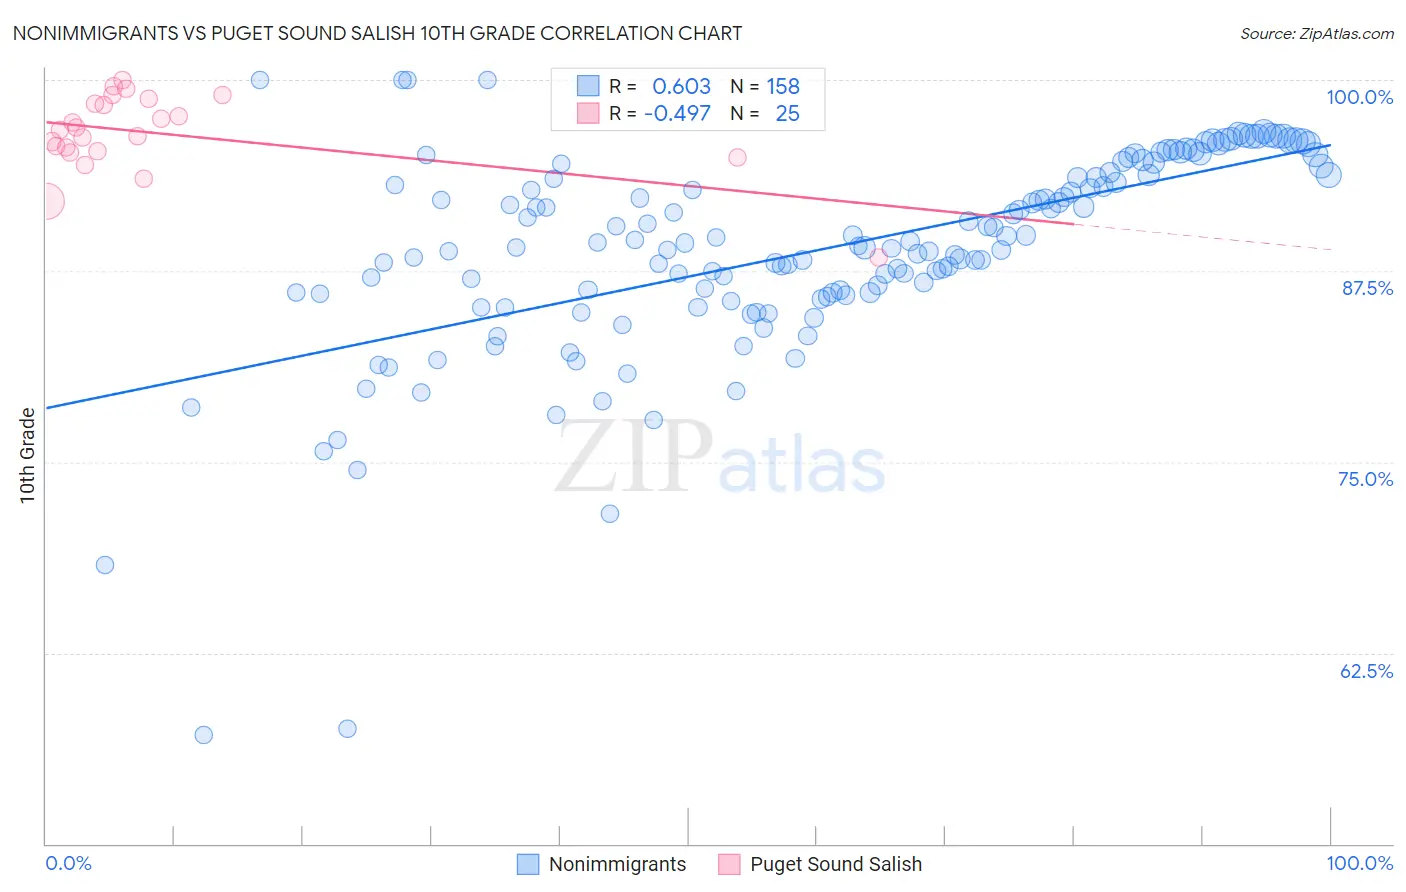
Nonimmigrants vs Puget Sound Salish 10th Grade Correlation Chart
The statistical analysis conducted on geographies consisting of 585,371,970 people shows a significant positive correlation between the proportion of Nonimmigrants and percentage of population with at least 10th grade education in the United States with a correlation coefficient (R) of 0.603 and weighted average of 94.1%. Similarly, the statistical analysis conducted on geographies consisting of 46,155,775 people shows a moderate negative correlation between the proportion of Puget Sound Salish and percentage of population with at least 10th grade education in the United States with a correlation coefficient (R) of -0.497 and weighted average of 94.7%, a difference of 0.66%.
10th Grade Correlation Summary
| Measurement | Nonimmigrants | Puget Sound Salish |
| Minimum | 57.2% | 88.4% |
| Maximum | 100.0% | 100.0% |
| Range | 42.8% | 11.6% |
| Mean | 88.9% | 96.5% |
| Median | 89.2% | 96.8% |
| Interquartile 25% (IQ1) | 86.0% | 95.3% |
| Interquartile 75% (IQ3) | 93.8% | 98.6% |
| Interquartile Range (IQR) | 7.8% | 3.3% |
| Standard Deviation (Sample) | 6.8% | 2.6% |
| Standard Deviation (Population) | 6.8% | 2.6% |
Similar Demographics by 10th Grade
Demographics Similar to Nonimmigrants by 10th Grade
In terms of 10th grade, the demographic groups most similar to Nonimmigrants are Cherokee (94.1%, a difference of 0.020%), Immigrants from Kazakhstan (94.1%, a difference of 0.020%), Chickasaw (94.1%, a difference of 0.020%), Immigrants from Ukraine (94.0%, a difference of 0.040%), and Arab (94.0%, a difference of 0.040%).
| Demographics | Rating | Rank | 10th Grade |
| Immigrants | Sri Lanka | 89.9 /100 | #138 | Excellent 94.2% |
| Immigrants | Bosnia and Herzegovina | 89.4 /100 | #139 | Excellent 94.2% |
| Immigrants | Jordan | 87.6 /100 | #140 | Excellent 94.1% |
| Hmong | 86.6 /100 | #141 | Excellent 94.1% |
| Albanians | 86.5 /100 | #142 | Excellent 94.1% |
| Cherokee | 84.9 /100 | #143 | Excellent 94.1% |
| Immigrants | Kazakhstan | 84.9 /100 | #144 | Excellent 94.1% |
| Immigrants | Nonimmigrants | 83.8 /100 | #145 | Excellent 94.1% |
| Chickasaw | 82.6 /100 | #146 | Excellent 94.1% |
| Immigrants | Ukraine | 81.5 /100 | #147 | Excellent 94.0% |
| Arabs | 80.9 /100 | #148 | Excellent 94.0% |
| Ugandans | 80.7 /100 | #149 | Excellent 94.0% |
| Egyptians | 79.6 /100 | #150 | Good 94.0% |
| Kenyans | 79.1 /100 | #151 | Good 94.0% |
| Immigrants | Italy | 78.0 /100 | #152 | Good 94.0% |
Demographics Similar to Puget Sound Salish by 10th Grade
In terms of 10th grade, the demographic groups most similar to Puget Sound Salish are Crow (94.7%, a difference of 0.0%), Immigrants from Western Europe (94.7%, a difference of 0.010%), Icelander (94.7%, a difference of 0.010%), Immigrants from Saudi Arabia (94.7%, a difference of 0.010%), and Immigrants from Japan (94.7%, a difference of 0.010%).
| Demographics | Rating | Rank | 10th Grade |
| Immigrants | Czechoslovakia | 99.2 /100 | #79 | Exceptional 94.7% |
| Immigrants | Denmark | 99.2 /100 | #80 | Exceptional 94.7% |
| Immigrants | Latvia | 99.2 /100 | #81 | Exceptional 94.7% |
| Swiss | 99.1 /100 | #82 | Exceptional 94.7% |
| Immigrants | Western Europe | 99.1 /100 | #83 | Exceptional 94.7% |
| Icelanders | 99.1 /100 | #84 | Exceptional 94.7% |
| Crow | 99.0 /100 | #85 | Exceptional 94.7% |
| Puget Sound Salish | 99.0 /100 | #86 | Exceptional 94.7% |
| Immigrants | Saudi Arabia | 99.0 /100 | #87 | Exceptional 94.7% |
| Immigrants | Japan | 99.0 /100 | #88 | Exceptional 94.7% |
| Immigrants | Moldova | 98.9 /100 | #89 | Exceptional 94.7% |
| South Africans | 98.8 /100 | #90 | Exceptional 94.7% |
| Whites/Caucasians | 98.8 /100 | #91 | Exceptional 94.7% |
| Yugoslavians | 98.4 /100 | #92 | Exceptional 94.6% |
| Soviet Union | 98.3 /100 | #93 | Exceptional 94.6% |