Nonimmigrants vs Immigrants from Cameroon 10th Grade
COMPARE
Nonimmigrants
Immigrants from Cameroon
10th Grade
10th Grade Comparison
Nonimmigrants
Immigrants from Cameroon
94.1%
10TH GRADE
83.8/ 100
METRIC RATING
145th/ 347
METRIC RANK
93.0%
10TH GRADE
2.6/ 100
METRIC RATING
242nd/ 347
METRIC RANK
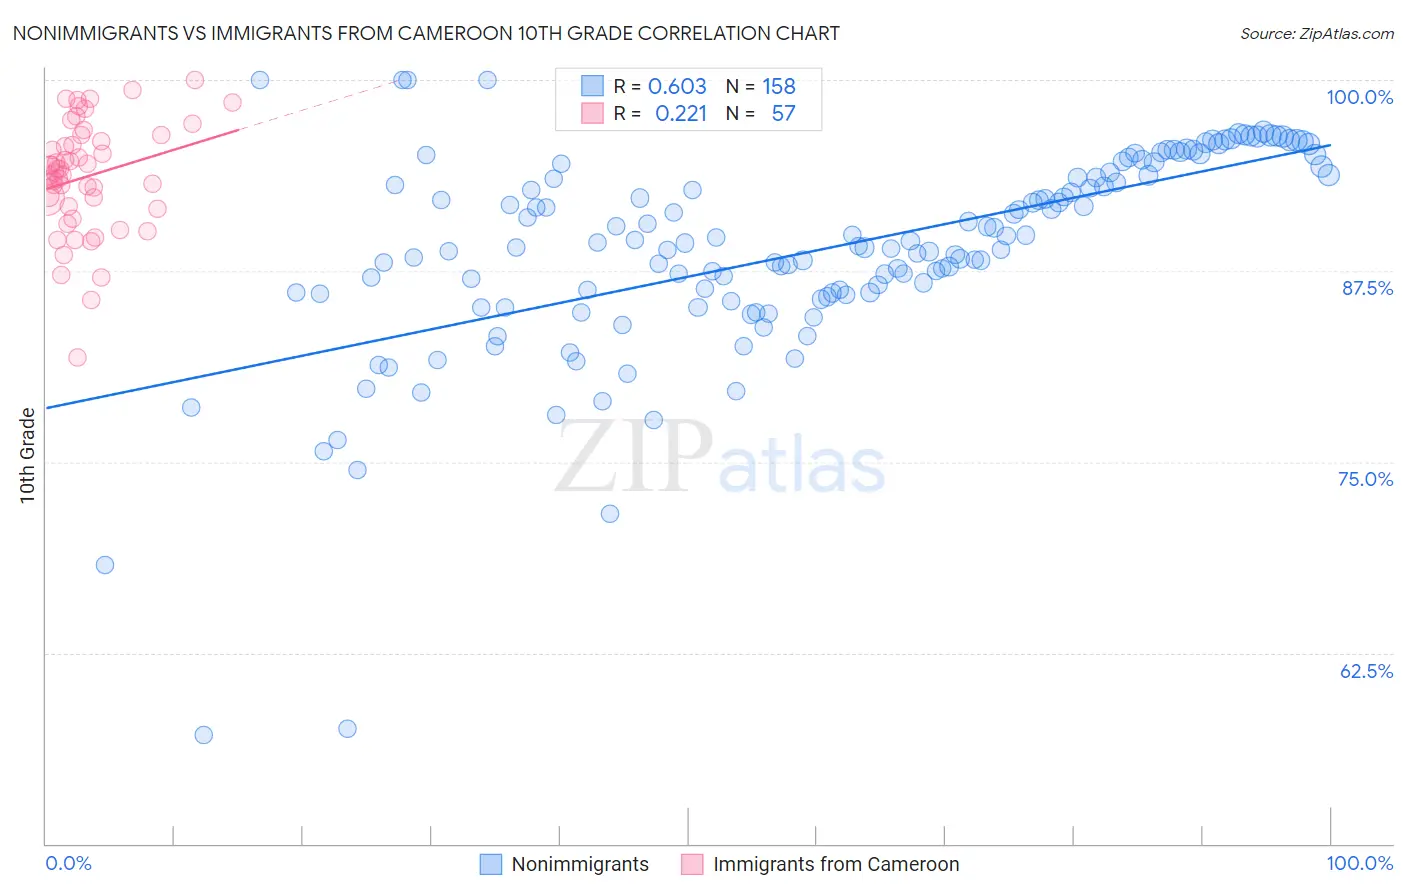
Nonimmigrants vs Immigrants from Cameroon 10th Grade Correlation Chart
The statistical analysis conducted on geographies consisting of 585,371,970 people shows a significant positive correlation between the proportion of Nonimmigrants and percentage of population with at least 10th grade education in the United States with a correlation coefficient (R) of 0.603 and weighted average of 94.1%. Similarly, the statistical analysis conducted on geographies consisting of 130,618,704 people shows a weak positive correlation between the proportion of Immigrants from Cameroon and percentage of population with at least 10th grade education in the United States with a correlation coefficient (R) of 0.221 and weighted average of 93.0%, a difference of 1.2%.
10th Grade Correlation Summary
| Measurement | Nonimmigrants | Immigrants from Cameroon |
| Minimum | 57.2% | 81.8% |
| Maximum | 100.0% | 100.0% |
| Range | 42.8% | 18.2% |
| Mean | 88.9% | 93.7% |
| Median | 89.2% | 93.9% |
| Interquartile 25% (IQ1) | 86.0% | 91.6% |
| Interquartile 75% (IQ3) | 93.8% | 96.2% |
| Interquartile Range (IQR) | 7.8% | 4.6% |
| Standard Deviation (Sample) | 6.8% | 3.7% |
| Standard Deviation (Population) | 6.8% | 3.6% |
Similar Demographics by 10th Grade
Demographics Similar to Nonimmigrants by 10th Grade
In terms of 10th grade, the demographic groups most similar to Nonimmigrants are Cherokee (94.1%, a difference of 0.020%), Immigrants from Kazakhstan (94.1%, a difference of 0.020%), Chickasaw (94.1%, a difference of 0.020%), Immigrants from Ukraine (94.0%, a difference of 0.040%), and Arab (94.0%, a difference of 0.040%).
| Demographics | Rating | Rank | 10th Grade |
| Immigrants | Sri Lanka | 89.9 /100 | #138 | Excellent 94.2% |
| Immigrants | Bosnia and Herzegovina | 89.4 /100 | #139 | Excellent 94.2% |
| Immigrants | Jordan | 87.6 /100 | #140 | Excellent 94.1% |
| Hmong | 86.6 /100 | #141 | Excellent 94.1% |
| Albanians | 86.5 /100 | #142 | Excellent 94.1% |
| Cherokee | 84.9 /100 | #143 | Excellent 94.1% |
| Immigrants | Kazakhstan | 84.9 /100 | #144 | Excellent 94.1% |
| Immigrants | Nonimmigrants | 83.8 /100 | #145 | Excellent 94.1% |
| Chickasaw | 82.6 /100 | #146 | Excellent 94.1% |
| Immigrants | Ukraine | 81.5 /100 | #147 | Excellent 94.0% |
| Arabs | 80.9 /100 | #148 | Excellent 94.0% |
| Ugandans | 80.7 /100 | #149 | Excellent 94.0% |
| Egyptians | 79.6 /100 | #150 | Good 94.0% |
| Kenyans | 79.1 /100 | #151 | Good 94.0% |
| Immigrants | Italy | 78.0 /100 | #152 | Good 94.0% |
Demographics Similar to Immigrants from Cameroon by 10th Grade
In terms of 10th grade, the demographic groups most similar to Immigrants from Cameroon are Immigrants from Somalia (93.0%, a difference of 0.0%), Senegalese (93.0%, a difference of 0.020%), Spanish American (92.9%, a difference of 0.050%), Uruguayan (92.9%, a difference of 0.080%), and Immigrants from Middle Africa (92.9%, a difference of 0.10%).
| Demographics | Rating | Rank | 10th Grade |
| Africans | 4.6 /100 | #235 | Tragic 93.1% |
| Afghans | 4.5 /100 | #236 | Tragic 93.1% |
| Immigrants | Panama | 4.3 /100 | #237 | Tragic 93.1% |
| Nigerians | 4.2 /100 | #238 | Tragic 93.1% |
| Costa Ricans | 4.2 /100 | #239 | Tragic 93.1% |
| Immigrants | Hong Kong | 4.2 /100 | #240 | Tragic 93.1% |
| Immigrants | Somalia | 2.7 /100 | #241 | Tragic 93.0% |
| Immigrants | Cameroon | 2.6 /100 | #242 | Tragic 93.0% |
| Senegalese | 2.4 /100 | #243 | Tragic 93.0% |
| Spanish Americans | 2.1 /100 | #244 | Tragic 92.9% |
| Uruguayans | 1.8 /100 | #245 | Tragic 92.9% |
| Immigrants | Middle Africa | 1.7 /100 | #246 | Tragic 92.9% |
| Immigrants | Afghanistan | 1.4 /100 | #247 | Tragic 92.8% |
| Colombians | 1.4 /100 | #248 | Tragic 92.8% |
| Immigrants | Senegal | 1.4 /100 | #249 | Tragic 92.8% |