Inupiat vs Puget Sound Salish 10th Grade
COMPARE
Inupiat
Puget Sound Salish
10th Grade
10th Grade Comparison
Inupiat
Puget Sound Salish
94.4%
10TH GRADE
95.1/ 100
METRIC RATING
122nd/ 347
METRIC RANK
94.7%
10TH GRADE
99.0/ 100
METRIC RATING
86th/ 347
METRIC RANK
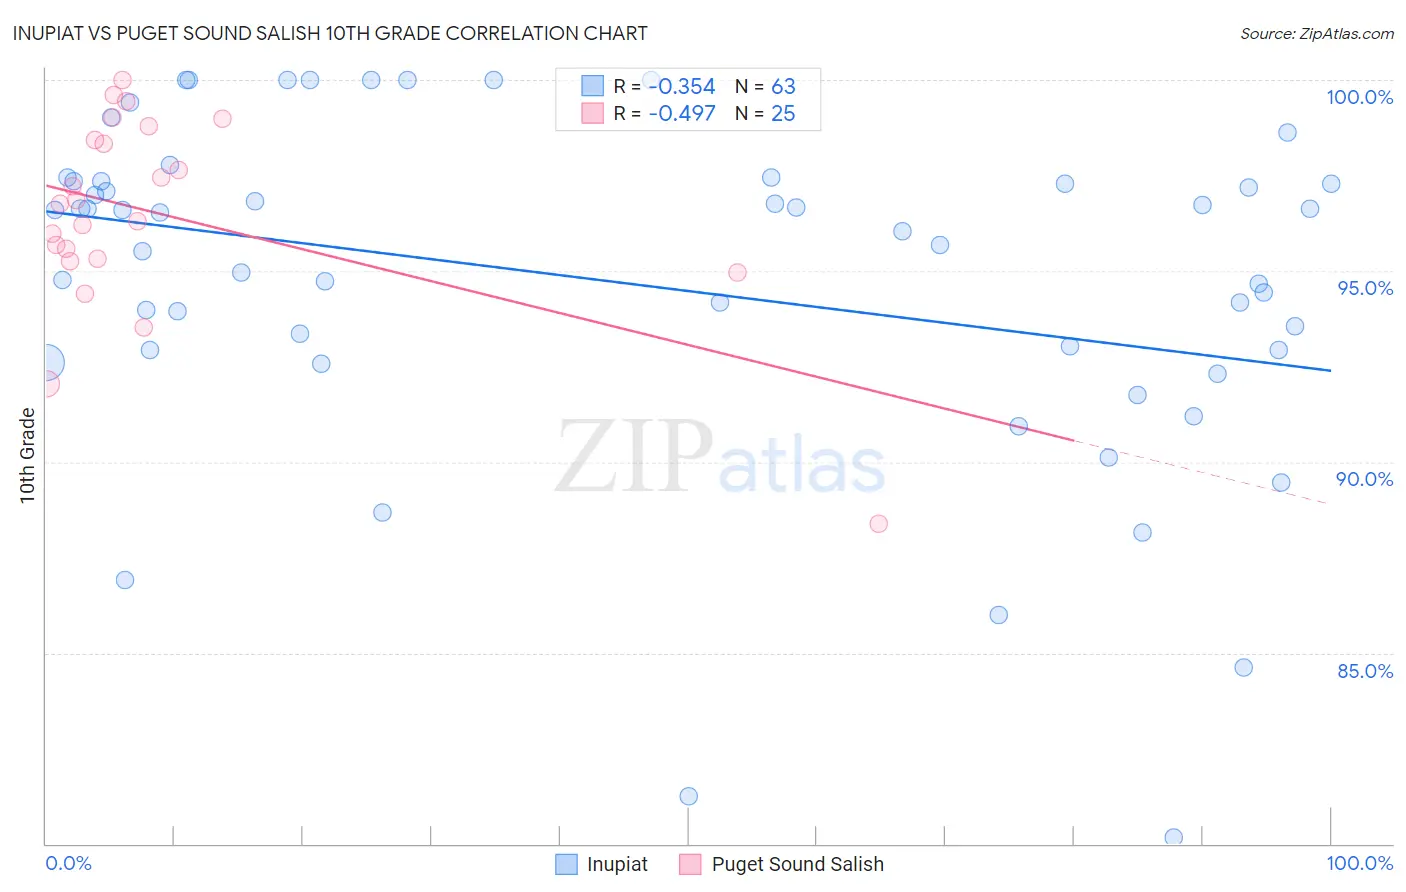
Inupiat vs Puget Sound Salish 10th Grade Correlation Chart
The statistical analysis conducted on geographies consisting of 96,349,240 people shows a mild negative correlation between the proportion of Inupiat and percentage of population with at least 10th grade education in the United States with a correlation coefficient (R) of -0.354 and weighted average of 94.4%. Similarly, the statistical analysis conducted on geographies consisting of 46,155,775 people shows a moderate negative correlation between the proportion of Puget Sound Salish and percentage of population with at least 10th grade education in the United States with a correlation coefficient (R) of -0.497 and weighted average of 94.7%, a difference of 0.37%.
10th Grade Correlation Summary
| Measurement | Inupiat | Puget Sound Salish |
| Minimum | 80.2% | 88.4% |
| Maximum | 100.0% | 100.0% |
| Range | 19.8% | 11.6% |
| Mean | 94.7% | 96.5% |
| Median | 96.0% | 96.8% |
| Interquartile 25% (IQ1) | 92.9% | 95.3% |
| Interquartile 75% (IQ3) | 97.3% | 98.6% |
| Interquartile Range (IQR) | 4.4% | 3.3% |
| Standard Deviation (Sample) | 4.4% | 2.6% |
| Standard Deviation (Population) | 4.4% | 2.6% |
Similar Demographics by 10th Grade
Demographics Similar to Inupiat by 10th Grade
In terms of 10th grade, the demographic groups most similar to Inupiat are Immigrants from Belarus (94.4%, a difference of 0.0%), Cree (94.4%, a difference of 0.0%), Immigrants from Israel (94.4%, a difference of 0.010%), Immigrants from Taiwan (94.4%, a difference of 0.010%), and Basque (94.3%, a difference of 0.010%).
| Demographics | Rating | Rank | 10th Grade |
| Delaware | 96.3 /100 | #115 | Exceptional 94.4% |
| Sioux | 96.2 /100 | #116 | Exceptional 94.4% |
| Immigrants | Hungary | 95.8 /100 | #117 | Exceptional 94.4% |
| Jordanians | 95.6 /100 | #118 | Exceptional 94.4% |
| Immigrants | Israel | 95.4 /100 | #119 | Exceptional 94.4% |
| Immigrants | Taiwan | 95.3 /100 | #120 | Exceptional 94.4% |
| Immigrants | Belarus | 95.2 /100 | #121 | Exceptional 94.4% |
| Inupiat | 95.1 /100 | #122 | Exceptional 94.4% |
| Cree | 95.1 /100 | #123 | Exceptional 94.4% |
| Basques | 94.9 /100 | #124 | Exceptional 94.3% |
| Americans | 94.4 /100 | #125 | Exceptional 94.3% |
| Immigrants | Iran | 94.4 /100 | #126 | Exceptional 94.3% |
| Israelis | 93.8 /100 | #127 | Exceptional 94.3% |
| Potawatomi | 93.6 /100 | #128 | Exceptional 94.3% |
| Iroquois | 92.8 /100 | #129 | Exceptional 94.3% |
Demographics Similar to Puget Sound Salish by 10th Grade
In terms of 10th grade, the demographic groups most similar to Puget Sound Salish are Crow (94.7%, a difference of 0.0%), Immigrants from Western Europe (94.7%, a difference of 0.010%), Icelander (94.7%, a difference of 0.010%), Immigrants from Saudi Arabia (94.7%, a difference of 0.010%), and Immigrants from Japan (94.7%, a difference of 0.010%).
| Demographics | Rating | Rank | 10th Grade |
| Immigrants | Czechoslovakia | 99.2 /100 | #79 | Exceptional 94.7% |
| Immigrants | Denmark | 99.2 /100 | #80 | Exceptional 94.7% |
| Immigrants | Latvia | 99.2 /100 | #81 | Exceptional 94.7% |
| Swiss | 99.1 /100 | #82 | Exceptional 94.7% |
| Immigrants | Western Europe | 99.1 /100 | #83 | Exceptional 94.7% |
| Icelanders | 99.1 /100 | #84 | Exceptional 94.7% |
| Crow | 99.0 /100 | #85 | Exceptional 94.7% |
| Puget Sound Salish | 99.0 /100 | #86 | Exceptional 94.7% |
| Immigrants | Saudi Arabia | 99.0 /100 | #87 | Exceptional 94.7% |
| Immigrants | Japan | 99.0 /100 | #88 | Exceptional 94.7% |
| Immigrants | Moldova | 98.9 /100 | #89 | Exceptional 94.7% |
| South Africans | 98.8 /100 | #90 | Exceptional 94.7% |
| Whites/Caucasians | 98.8 /100 | #91 | Exceptional 94.7% |
| Yugoslavians | 98.4 /100 | #92 | Exceptional 94.6% |
| Soviet Union | 98.3 /100 | #93 | Exceptional 94.6% |