Nonimmigrants vs Guatemalan 10th Grade

COMPARE

Nonimmigrants
Race
Ancestry
AfghanAfricanAlaska NativeAlaskan AthabascanAlbanianAleutAlsatianAmericanApacheArabArapahoArgentineanArmenianAssyrian/Chaldean/SyriacAustralianAustrianBahamianBangladeshiBarbadianBasqueBelgianBelizeanBermudanBhutaneseBlackfeetBolivianBrazilianBritishBritish West IndianBulgarianBurmeseCajunCambodianCanadianCape VerdeanCarpatho RusynCelticCentral AmericanCentral American IndianCherokeeCheyenneChickasawChileanChineseChippewaChoctawColombianColvilleComancheCosta RicanCreeCreekCroatianCrowCubanCypriotCzechCzechoslovakianDanishDelawareDominicanDutchDutch West IndianEastern EuropeanEcuadorianEgyptianEnglishEstonianEthiopianEuropeanFijianFilipinoFinnishFrenchFrench American IndianFrench CanadianGermanGerman RussianGhanaianGreekGuamanian/ChamorroGuyaneseHaitianHmongHonduranHopiHoumaHungarianIcelanderIndian (Asian)IndonesianInupiatIranianIraqiIrishIroquoisIsraeliItalianJamaicanJapaneseJordanianKenyanKiowaKoreanLaotianLatvianLebaneseLiberianLithuanianLumbeeLuxembourgerMacedonianMalaysianMalteseMarshalleseMenomineeMexicanMexican American IndianMongolianMoroccanNative HawaiianNavajoNepaleseNew ZealanderNicaraguanNigerianNorthern EuropeanNorwegianOkinawanOsageOttawaPaiutePakistaniPalestinianPanamanianParaguayanPennsylvania GermanPeruvianPimaPolishPortuguesePotawatomiPuebloPuerto RicanPuget Sound SalishRomanianRussianSalvadoranSamoanScandinavianScotch-IrishScottishSeminoleSenegaleseSerbianShoshoneSierra LeoneanSiouxSlavicSlovakSloveneSomaliSouth AfricanSouth AmericanSouth American IndianSoviet UnionSpaniardSpanishSpanish AmericanSpanish American IndianSri LankanSubsaharan AfricanSudaneseSwedishSwissSyrianTaiwaneseThaiTlingit-HaidaTohono O'OdhamTonganTrinidadian and TobagonianTsimshianTurkishU.S. Virgin IslanderUgandanUkrainianUruguayanUteVenezuelanVietnameseWelshWest IndianYakamaYaquiYugoslavianYumanYup'ikZimbabwean
Immigration
NonimmigrantsImmigrantsAfghanistanAfricaAlbaniaArgentinaArmeniaAsiaAustraliaAustriaBahamasBangladeshBarbadosBelarusBelgiumBelizeBoliviaBosnia and HerzegovinaBrazilBulgariaBurma/MyanmarCabo VerdeCambodiaCameroonCanadaCaribbeanCentral AmericaChileChinaColombiaCongoCosta RicaCroatiaCubaCzechoslovakiaDenmarkDominicaDominican RepublicEastern AfricaEastern AsiaEastern EuropeEcuadorEgyptEl SalvadorEnglandEritreaEthiopiaEuropeFijiFranceGermanyGhanaGreeceGrenadaGuatemalaGuyanaHaitiHondurasHong KongHungaryIndiaIndonesiaIranIraqIrelandIsraelItalyJamaicaJapanJordanKazakhstanKenyaKoreaKuwaitLaosLatin AmericaLatviaLebanonLiberiaLithuaniaMalaysiaMexicoMicronesiaMiddle AfricaMoldovaMoroccoNepalNetherlandsNicaraguaNigeriaNorth AmericaNorth MacedoniaNorthern AfricaNorthern EuropeNorwayOceaniaPakistanPanamaPeruPhilippinesPolandPortugalRomaniaRussiaSaudi ArabiaScotlandSenegalSerbiaSierra LeoneSingaporeSomaliaSouth AfricaSouth AmericaSouth Central AsiaSouth Eastern AsiaSouthern EuropeSpainSri LankaSt. Vincent and the GrenadinesSudanSwedenSwitzerlandSyriaTaiwanThailandTrinidad and TobagoTurkeyUgandaUkraineUruguayUzbekistanVenezuelaVietnamWest IndiesWestern AfricaWestern AsiaWestern EuropeYemenZaireZimbabweAzores
Guatemalan
Race
Ancestry
AfghanAfricanAlaska NativeAlaskan AthabascanAlbanianAleutAlsatianAmericanApacheArabArapahoArgentineanArmenianAssyrian/Chaldean/SyriacAustralianAustrianBahamianBangladeshiBarbadianBasqueBelgianBelizeanBermudanBhutaneseBlackfeetBolivianBrazilianBritishBritish West IndianBulgarianBurmeseCajunCambodianCanadianCape VerdeanCarpatho RusynCelticCentral AmericanCentral American IndianCherokeeCheyenneChickasawChileanChineseChippewaChoctawColombianColvilleComancheCosta RicanCreeCreekCroatianCrowCubanCypriotCzechCzechoslovakianDanishDelawareDominicanDutchDutch West IndianEastern EuropeanEcuadorianEgyptianEnglishEstonianEthiopianEuropeanFijianFilipinoFinnishFrenchFrench American IndianFrench CanadianGermanGerman RussianGhanaianGreekGuamanian/ChamorroGuatemalanGuyaneseHaitianHmongHonduranHopiHoumaHungarianIcelanderIndian (Asian)IndonesianInupiatIranianIraqiIrishIroquoisIsraeliItalianJamaicanJapaneseJordanianKenyanKiowaKoreanLaotianLatvianLebaneseLiberianLithuanianLumbeeLuxembourgerMacedonianMalaysianMalteseMarshalleseMenomineeMexicanMexican American IndianMongolianMoroccanNative HawaiianNavajoNepaleseNew ZealanderNicaraguanNigerianNorthern EuropeanNorwegianOkinawanOsageOttawaPaiutePakistaniPalestinianPanamanianParaguayanPennsylvania GermanPeruvianPimaPolishPortuguesePotawatomiPuebloPuerto RicanPuget Sound SalishRomanianRussianSalvadoranSamoanScandinavianScotch-IrishScottishSeminoleSenegaleseSerbianShoshoneSierra LeoneanSiouxSlavicSlovakSloveneSomaliSouth AfricanSouth AmericanSouth American IndianSoviet UnionSpaniardSpanishSpanish AmericanSpanish American IndianSri LankanSubsaharan AfricanSudaneseSwedishSwissSyrianTaiwaneseThaiTlingit-HaidaTohono O'OdhamTonganTrinidadian and TobagonianTsimshianTurkishU.S. Virgin IslanderUgandanUkrainianUruguayanUteVenezuelanVietnameseWelshWest IndianYakamaYaquiYugoslavianYumanYup'ikZimbabwean
Immigration
ImmigrantsAfghanistanAfricaAlbaniaArgentinaArmeniaAsiaAustraliaAustriaBahamasBangladeshBarbadosBelarusBelgiumBelizeBoliviaBosnia and HerzegovinaBrazilBulgariaBurma/MyanmarCabo VerdeCambodiaCameroonCanadaCaribbeanCentral AmericaChileChinaColombiaCongoCosta RicaCroatiaCubaCzechoslovakiaDenmarkDominicaDominican RepublicEastern AfricaEastern AsiaEastern EuropeEcuadorEgyptEl SalvadorEnglandEritreaEthiopiaEuropeFijiFranceGermanyGhanaGreeceGrenadaGuatemalaGuyanaHaitiHondurasHong KongHungaryIndiaIndonesiaIranIraqIrelandIsraelItalyJamaicaJapanJordanKazakhstanKenyaKoreaKuwaitLaosLatin AmericaLatviaLebanonLiberiaLithuaniaMalaysiaMexicoMicronesiaMiddle AfricaMoldovaMoroccoNepalNetherlandsNicaraguaNigeriaNorth AmericaNorth MacedoniaNorthern AfricaNorthern EuropeNorwayOceaniaPakistanPanamaPeruPhilippinesPolandPortugalRomaniaRussiaSaudi ArabiaScotlandSenegalSerbiaSierra LeoneSingaporeSomaliaSouth AfricaSouth AmericaSouth Central AsiaSouth Eastern AsiaSouthern EuropeSpainSri LankaSt. Vincent and the GrenadinesSudanSwedenSwitzerlandSyriaTaiwanThailandTrinidad and TobagoTurkeyUgandaUkraineUruguayUzbekistanVenezuelaVietnamWest IndiesWestern AfricaWestern AsiaWestern EuropeYemenZaireZimbabweAzores
10th Grade
Income
Poverty
Unemployment
Labor Participation
Family Structure
Vehicle Availability
Education Level
Disability

10th Grade Comparison

Nonimmigrants

Guatemalans

Excellent
Tragic
94.1%
10TH GRADE
83.8/ 100
METRIC RATING
145th/ 347
METRIC RANK
87.9%
10TH GRADE
0.0/ 100
METRIC RATING
339th/ 347
METRIC RANK

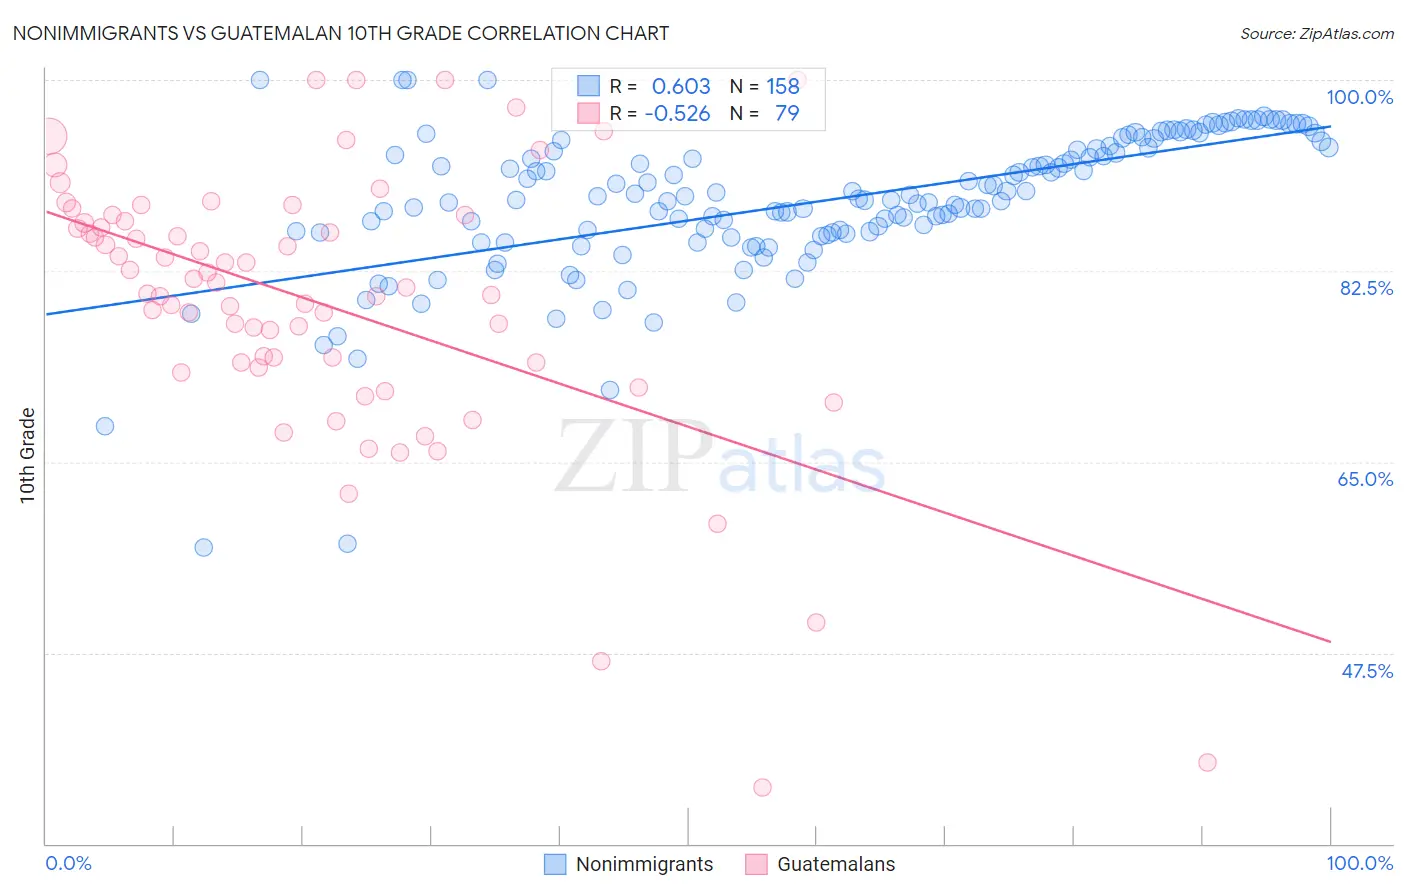
Nonimmigrants vs Guatemalan 10th Grade Correlation Chart

The statistical analysis conducted on geographies consisting of 585,371,970 people shows a significant positive correlation between the proportion of Nonimmigrants and percentage of population with at least 10th grade education in the United States with a correlation coefficient (R) of 0.603 and weighted average of 94.1%. Similarly, the statistical analysis conducted on geographies consisting of 409,566,618 people shows a substantial negative correlation between the proportion of Guatemalans and percentage of population with at least 10th grade education in the United States with a correlation coefficient (R) of -0.526 and weighted average of 87.9%, a difference of 7.0%.
Nonimmigrants vs Guatemalan 10th Grade

10th Grade Correlation Summary

MeasurementNonimmigrantsGuatemalan
Minimum57.2%35.2%
Maximum100.0%100.0%
Range42.8%64.8%
Mean88.9%79.6%
Median89.2%81.0%
Interquartile 25% (IQ1)86.0%74.1%
Interquartile 75% (IQ3)93.8%87.0%
Interquartile Range (IQR)7.8%12.9%
Standard Deviation (Sample)6.8%12.6%
Standard Deviation (Population)6.8%12.5%

Similar Demographics by 10th Grade

Demographics Similar to Nonimmigrants by 10th Grade

In terms of 10th grade, the demographic groups most similar to Nonimmigrants are Cherokee (94.1%, a difference of 0.020%), Immigrants from Kazakhstan (94.1%, a difference of 0.020%), Chickasaw (94.1%, a difference of 0.020%), Immigrants from Ukraine (94.0%, a difference of 0.040%), and Arab (94.0%, a difference of 0.040%).
DemographicsRating | Rank10th Grade
Immigrants | Sri Lanka
89.9
/100
|
#138
Excellent
94.2%
Immigrants | Bosnia and Herzegovina
89.4
/100
|
#139
Excellent
94.2%
Immigrants | Jordan
87.6
/100
|
#140
Excellent
94.1%
Hmong
86.6
/100
|
#141
Excellent
94.1%
Albanians
86.5
/100
|
#142
Excellent
94.1%
Cherokee
84.9
/100
|
#143
Excellent
94.1%
Immigrants | Kazakhstan
84.9
/100
|
#144
Excellent
94.1%
Immigrants | Nonimmigrants
83.8
/100
|
#145
Excellent
94.1%
Chickasaw
82.6
/100
|
#146
Excellent
94.1%
Immigrants | Ukraine
81.5
/100
|
#147
Excellent
94.0%
Arabs
80.9
/100
|
#148
Excellent
94.0%
Ugandans
80.7
/100
|
#149
Excellent
94.0%
Egyptians
79.6
/100
|
#150
Good
94.0%
Kenyans
79.1
/100
|
#151
Good
94.0%
Immigrants | Italy
78.0
/100
|
#152
Good
94.0%

Demographics Similar to Guatemalans by 10th Grade

In terms of 10th grade, the demographic groups most similar to Guatemalans are Mexican (87.8%, a difference of 0.16%), Salvadoran (87.5%, a difference of 0.44%), Immigrants from Latin America (88.3%, a difference of 0.49%), Central American (88.4%, a difference of 0.56%), and Immigrants from Guatemala (87.4%, a difference of 0.60%).
DemographicsRating | Rank10th Grade
Immigrants | Azores
0.0
/100
|
#332
Tragic
89.0%
Hondurans
0.0
/100
|
#333
Tragic
89.0%
Hispanics or Latinos
0.0
/100
|
#334
Tragic
88.9%
Immigrants | Dominican Republic
0.0
/100
|
#335
Tragic
88.7%
Immigrants | Honduras
0.0
/100
|
#336
Tragic
88.5%
Central Americans
0.0
/100
|
#337
Tragic
88.4%
Immigrants | Latin America
0.0
/100
|
#338
Tragic
88.3%
Guatemalans
0.0
/100
|
#339
Tragic
87.9%
Mexicans
0.0
/100
|
#340
Tragic
87.8%
Salvadorans
0.0
/100
|
#341
Tragic
87.5%
Immigrants | Guatemala
0.0
/100
|
#342
Tragic
87.4%
Yakama
0.0
/100
|
#343
Tragic
86.9%
Immigrants | El Salvador
0.0
/100
|
#344
Tragic
86.8%
Immigrants | Central America
0.0
/100
|
#345
Tragic
86.6%
Spanish American Indians
0.0
/100
|
#346
Tragic
86.2%