Moroccan vs Puget Sound Salish 10th Grade
COMPARE
Moroccan
Puget Sound Salish
10th Grade
10th Grade Comparison
Moroccans
Puget Sound Salish
93.5%
10TH GRADE
25.3/ 100
METRIC RATING
196th/ 347
METRIC RANK
94.7%
10TH GRADE
99.0/ 100
METRIC RATING
86th/ 347
METRIC RANK
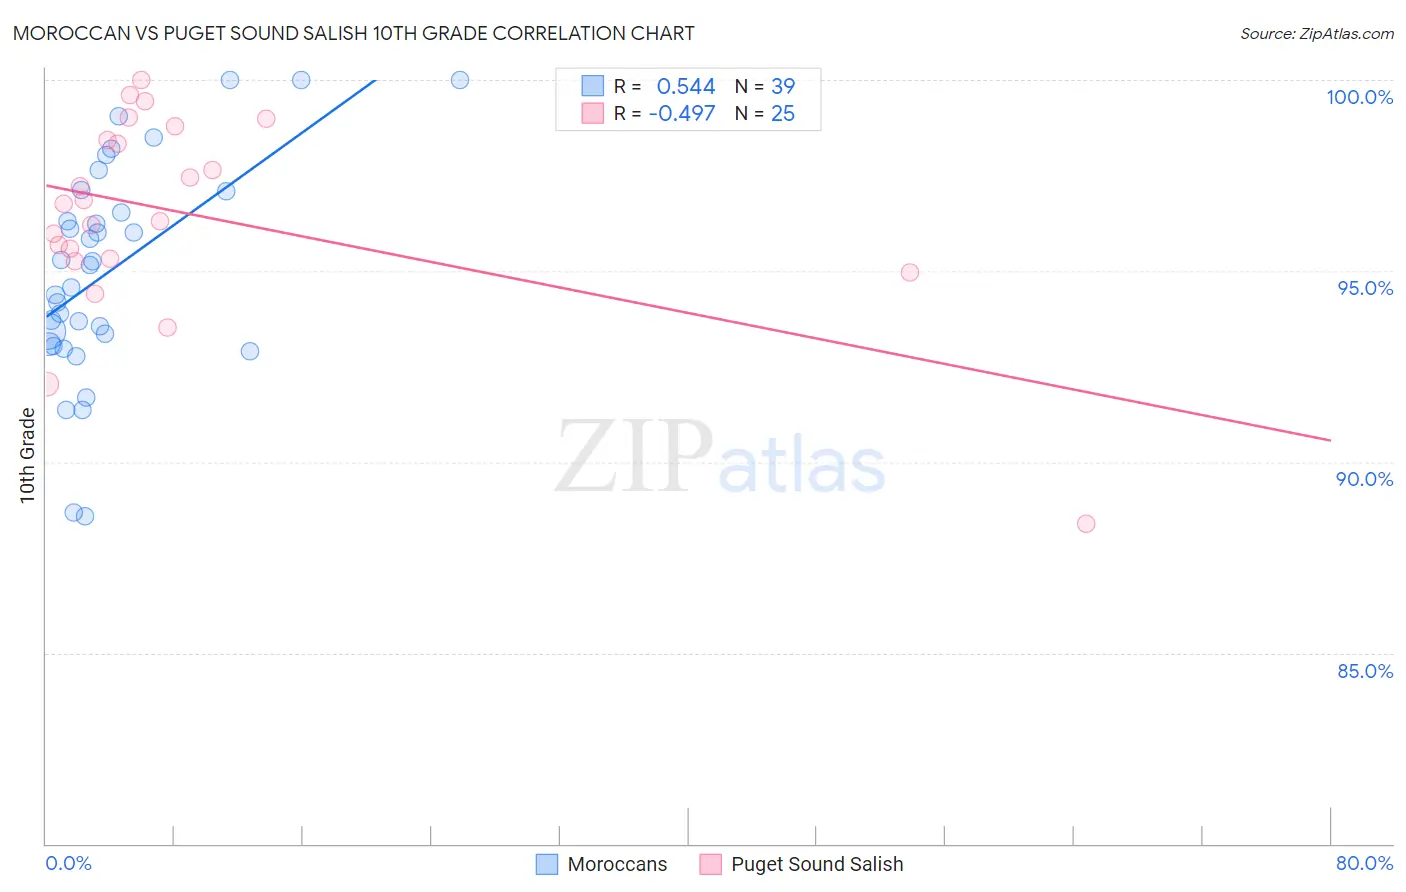
Moroccan vs Puget Sound Salish 10th Grade Correlation Chart
The statistical analysis conducted on geographies consisting of 201,817,667 people shows a substantial positive correlation between the proportion of Moroccans and percentage of population with at least 10th grade education in the United States with a correlation coefficient (R) of 0.544 and weighted average of 93.5%. Similarly, the statistical analysis conducted on geographies consisting of 46,155,775 people shows a moderate negative correlation between the proportion of Puget Sound Salish and percentage of population with at least 10th grade education in the United States with a correlation coefficient (R) of -0.497 and weighted average of 94.7%, a difference of 1.3%.
10th Grade Correlation Summary
| Measurement | Moroccan | Puget Sound Salish |
| Minimum | 88.6% | 88.4% |
| Maximum | 100.0% | 100.0% |
| Range | 11.4% | 11.6% |
| Mean | 95.0% | 96.5% |
| Median | 95.2% | 96.8% |
| Interquartile 25% (IQ1) | 93.1% | 95.3% |
| Interquartile 75% (IQ3) | 97.1% | 98.6% |
| Interquartile Range (IQR) | 4.0% | 3.3% |
| Standard Deviation (Sample) | 2.8% | 2.6% |
| Standard Deviation (Population) | 2.8% | 2.6% |
Similar Demographics by 10th Grade
Demographics Similar to Moroccans by 10th Grade
In terms of 10th grade, the demographic groups most similar to Moroccans are Immigrants from Morocco (93.5%, a difference of 0.020%), Cheyenne (93.5%, a difference of 0.020%), Pueblo (93.5%, a difference of 0.020%), Immigrants from Malaysia (93.5%, a difference of 0.030%), and Panamanian (93.5%, a difference of 0.030%).
| Demographics | Rating | Rank | 10th Grade |
| Immigrants | Pakistan | 32.5 /100 | #189 | Fair 93.6% |
| Laotians | 32.1 /100 | #190 | Fair 93.6% |
| Yup'ik | 31.1 /100 | #191 | Fair 93.6% |
| Immigrants | Malaysia | 28.0 /100 | #192 | Fair 93.5% |
| Panamanians | 28.0 /100 | #193 | Fair 93.5% |
| Immigrants | Morocco | 26.9 /100 | #194 | Fair 93.5% |
| Cheyenne | 26.8 /100 | #195 | Fair 93.5% |
| Moroccans | 25.3 /100 | #196 | Fair 93.5% |
| Pueblo | 23.9 /100 | #197 | Fair 93.5% |
| Immigrants | Micronesia | 23.2 /100 | #198 | Fair 93.5% |
| Asians | 23.0 /100 | #199 | Fair 93.5% |
| Hopi | 22.2 /100 | #200 | Fair 93.5% |
| Hawaiians | 21.8 /100 | #201 | Fair 93.5% |
| Immigrants | Uganda | 20.9 /100 | #202 | Fair 93.5% |
| Immigrants | Western Asia | 20.6 /100 | #203 | Fair 93.4% |
Demographics Similar to Puget Sound Salish by 10th Grade
In terms of 10th grade, the demographic groups most similar to Puget Sound Salish are Crow (94.7%, a difference of 0.0%), Immigrants from Western Europe (94.7%, a difference of 0.010%), Icelander (94.7%, a difference of 0.010%), Immigrants from Saudi Arabia (94.7%, a difference of 0.010%), and Immigrants from Japan (94.7%, a difference of 0.010%).
| Demographics | Rating | Rank | 10th Grade |
| Immigrants | Czechoslovakia | 99.2 /100 | #79 | Exceptional 94.7% |
| Immigrants | Denmark | 99.2 /100 | #80 | Exceptional 94.7% |
| Immigrants | Latvia | 99.2 /100 | #81 | Exceptional 94.7% |
| Swiss | 99.1 /100 | #82 | Exceptional 94.7% |
| Immigrants | Western Europe | 99.1 /100 | #83 | Exceptional 94.7% |
| Icelanders | 99.1 /100 | #84 | Exceptional 94.7% |
| Crow | 99.0 /100 | #85 | Exceptional 94.7% |
| Puget Sound Salish | 99.0 /100 | #86 | Exceptional 94.7% |
| Immigrants | Saudi Arabia | 99.0 /100 | #87 | Exceptional 94.7% |
| Immigrants | Japan | 99.0 /100 | #88 | Exceptional 94.7% |
| Immigrants | Moldova | 98.9 /100 | #89 | Exceptional 94.7% |
| South Africans | 98.8 /100 | #90 | Exceptional 94.7% |
| Whites/Caucasians | 98.8 /100 | #91 | Exceptional 94.7% |
| Yugoslavians | 98.4 /100 | #92 | Exceptional 94.6% |
| Soviet Union | 98.3 /100 | #93 | Exceptional 94.6% |