Immigrants from Latvia vs Puget Sound Salish 10th Grade
COMPARE
Immigrants from Latvia
Puget Sound Salish
10th Grade
10th Grade Comparison
Immigrants from Latvia
Puget Sound Salish
94.7%
10TH GRADE
99.2/ 100
METRIC RATING
81st/ 347
METRIC RANK
94.7%
10TH GRADE
99.0/ 100
METRIC RATING
86th/ 347
METRIC RANK
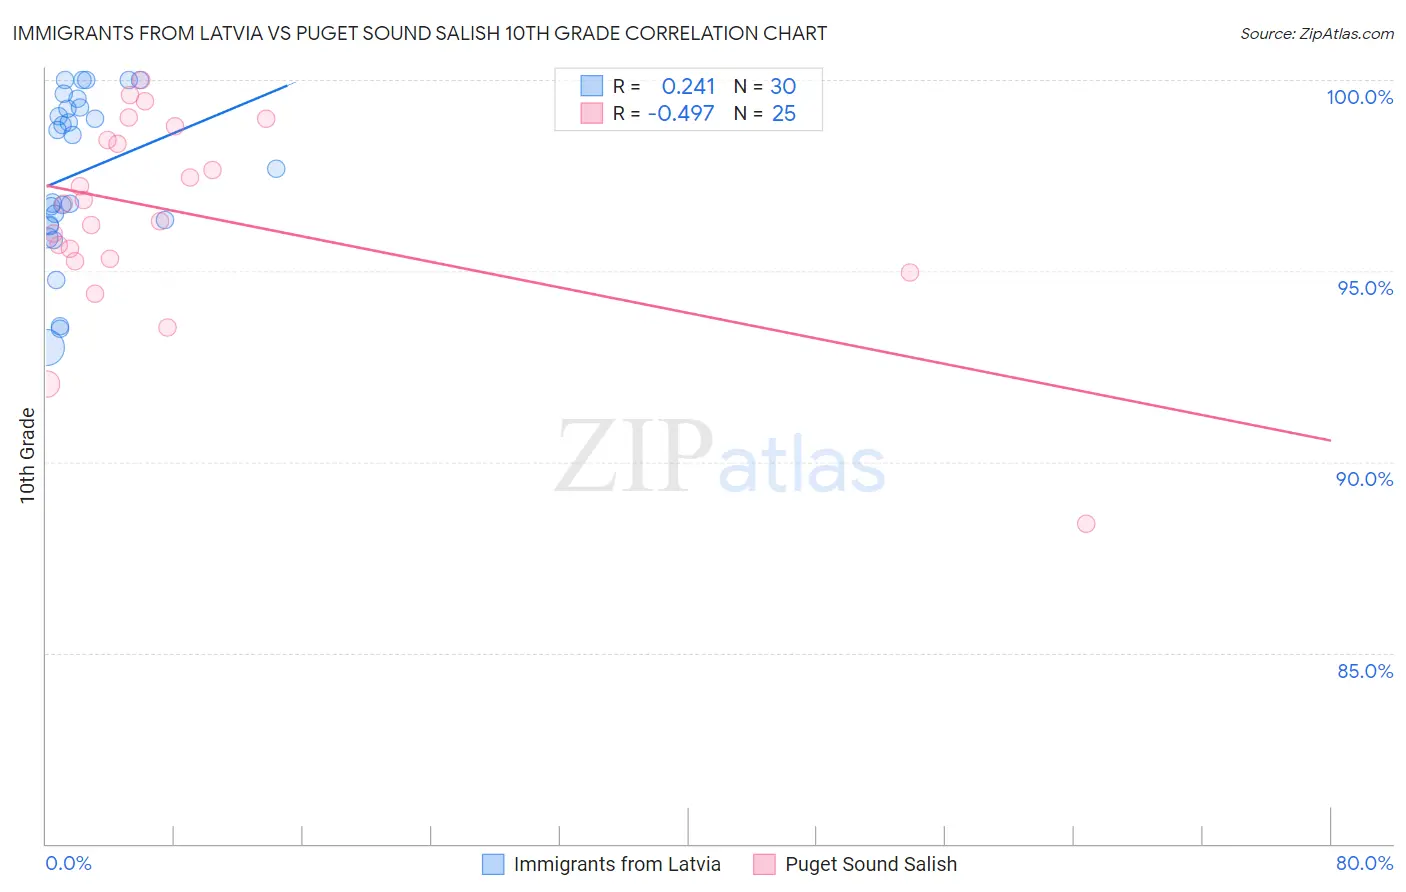
Immigrants from Latvia vs Puget Sound Salish 10th Grade Correlation Chart
The statistical analysis conducted on geographies consisting of 113,734,781 people shows a weak positive correlation between the proportion of Immigrants from Latvia and percentage of population with at least 10th grade education in the United States with a correlation coefficient (R) of 0.241 and weighted average of 94.7%. Similarly, the statistical analysis conducted on geographies consisting of 46,155,775 people shows a moderate negative correlation between the proportion of Puget Sound Salish and percentage of population with at least 10th grade education in the United States with a correlation coefficient (R) of -0.497 and weighted average of 94.7%, a difference of 0.050%.
10th Grade Correlation Summary
| Measurement | Immigrants from Latvia | Puget Sound Salish |
| Minimum | 93.0% | 88.4% |
| Maximum | 100.0% | 100.0% |
| Range | 7.0% | 11.6% |
| Mean | 97.6% | 96.5% |
| Median | 98.1% | 96.8% |
| Interquartile 25% (IQ1) | 96.2% | 95.3% |
| Interquartile 75% (IQ3) | 99.3% | 98.6% |
| Interquartile Range (IQR) | 3.1% | 3.3% |
| Standard Deviation (Sample) | 2.1% | 2.6% |
| Standard Deviation (Population) | 2.1% | 2.6% |
Demographics Similar to Immigrants from Latvia and Puget Sound Salish by 10th Grade
In terms of 10th grade, the demographic groups most similar to Immigrants from Latvia are Immigrants from Denmark (94.7%, a difference of 0.0%), Immigrants from Czechoslovakia (94.7%, a difference of 0.010%), Swiss (94.7%, a difference of 0.030%), Immigrants from Western Europe (94.7%, a difference of 0.030%), and Filipino (94.8%, a difference of 0.040%). Similarly, the demographic groups most similar to Puget Sound Salish are Crow (94.7%, a difference of 0.0%), Immigrants from Western Europe (94.7%, a difference of 0.010%), Icelander (94.7%, a difference of 0.010%), Immigrants from Saudi Arabia (94.7%, a difference of 0.010%), and Immigrants from Japan (94.7%, a difference of 0.010%).
| Demographics | Rating | Rank | 10th Grade |
| Bhutanese | 99.6 /100 | #73 | Exceptional 94.9% |
| Canadians | 99.6 /100 | #74 | Exceptional 94.9% |
| Okinawans | 99.5 /100 | #75 | Exceptional 94.8% |
| Romanians | 99.5 /100 | #76 | Exceptional 94.8% |
| Immigrants | South Africa | 99.5 /100 | #77 | Exceptional 94.8% |
| Filipinos | 99.3 /100 | #78 | Exceptional 94.8% |
| Immigrants | Czechoslovakia | 99.2 /100 | #79 | Exceptional 94.7% |
| Immigrants | Denmark | 99.2 /100 | #80 | Exceptional 94.7% |
| Immigrants | Latvia | 99.2 /100 | #81 | Exceptional 94.7% |
| Swiss | 99.1 /100 | #82 | Exceptional 94.7% |
| Immigrants | Western Europe | 99.1 /100 | #83 | Exceptional 94.7% |
| Icelanders | 99.1 /100 | #84 | Exceptional 94.7% |
| Crow | 99.0 /100 | #85 | Exceptional 94.7% |
| Puget Sound Salish | 99.0 /100 | #86 | Exceptional 94.7% |
| Immigrants | Saudi Arabia | 99.0 /100 | #87 | Exceptional 94.7% |
| Immigrants | Japan | 99.0 /100 | #88 | Exceptional 94.7% |
| Immigrants | Moldova | 98.9 /100 | #89 | Exceptional 94.7% |
| South Africans | 98.8 /100 | #90 | Exceptional 94.7% |
| Whites/Caucasians | 98.8 /100 | #91 | Exceptional 94.7% |
| Yugoslavians | 98.4 /100 | #92 | Exceptional 94.6% |
| Soviet Union | 98.3 /100 | #93 | Exceptional 94.6% |