Nonimmigrants vs Puget Sound Salish Hearing Disability
COMPARE
Nonimmigrants
Puget Sound Salish
Hearing Disability
Hearing Disability Comparison
Nonimmigrants
Puget Sound Salish
3.6%
HEARING DISABILITY
0.0/ 100
METRIC RATING
277th/ 347
METRIC RANK
3.9%
HEARING DISABILITY
0.0/ 100
METRIC RATING
315th/ 347
METRIC RANK
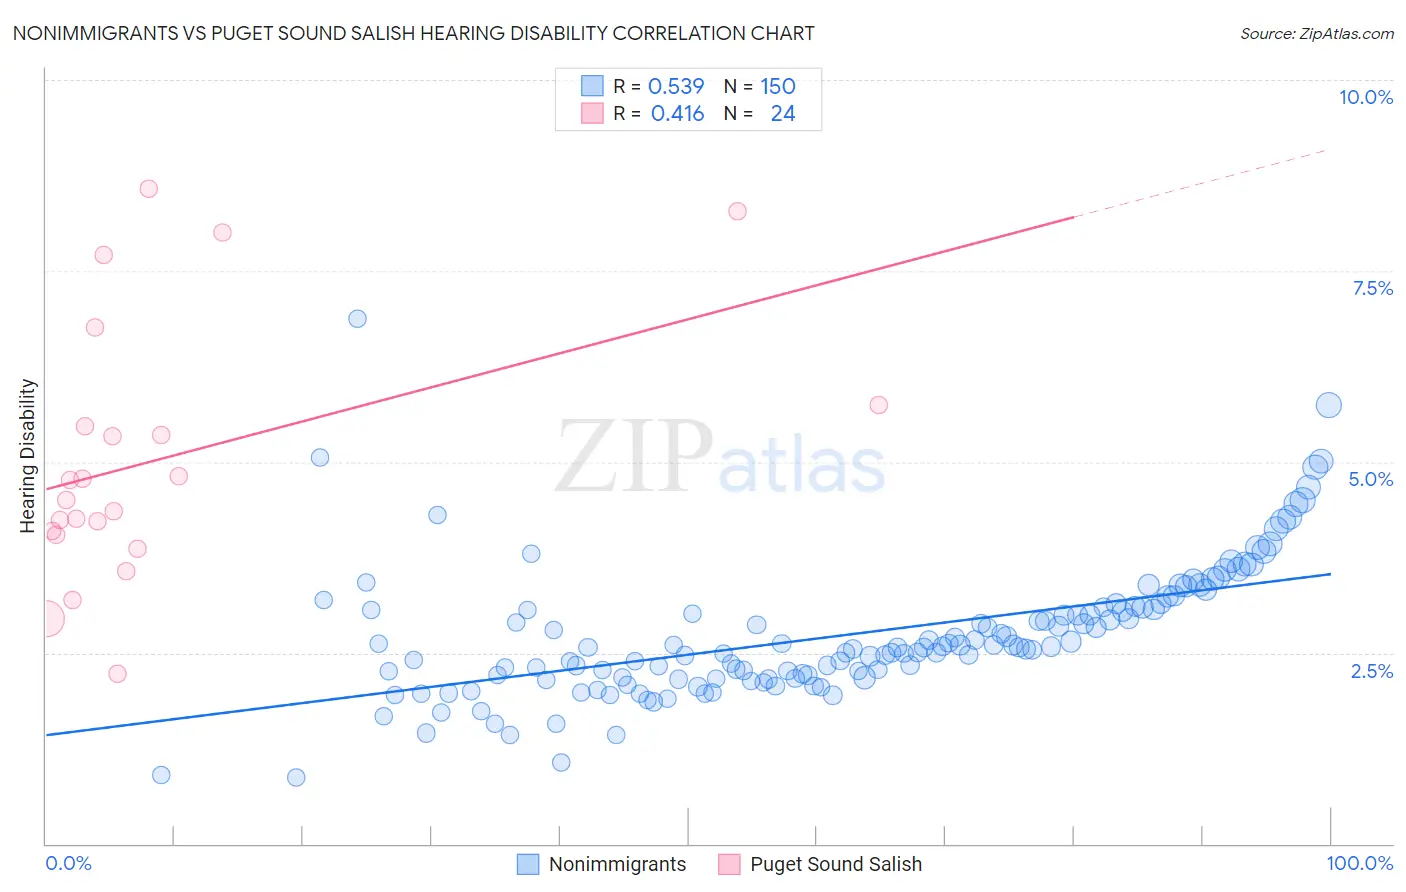
Nonimmigrants vs Puget Sound Salish Hearing Disability Correlation Chart
The statistical analysis conducted on geographies consisting of 583,885,168 people shows a substantial positive correlation between the proportion of Nonimmigrants and percentage of population with hearing disability in the United States with a correlation coefficient (R) of 0.539 and weighted average of 3.6%. Similarly, the statistical analysis conducted on geographies consisting of 46,152,047 people shows a moderate positive correlation between the proportion of Puget Sound Salish and percentage of population with hearing disability in the United States with a correlation coefficient (R) of 0.416 and weighted average of 3.9%, a difference of 10.3%.
Hearing Disability Correlation Summary
| Measurement | Nonimmigrants | Puget Sound Salish |
| Minimum | 0.87% | 2.2% |
| Maximum | 6.9% | 8.6% |
| Range | 6.0% | 6.3% |
| Mean | 2.7% | 5.0% |
| Median | 2.6% | 4.6% |
| Interquartile 25% (IQ1) | 2.2% | 4.1% |
| Interquartile 75% (IQ3) | 3.1% | 5.6% |
| Interquartile Range (IQR) | 0.92% | 1.5% |
| Standard Deviation (Sample) | 0.88% | 1.7% |
| Standard Deviation (Population) | 0.88% | 1.7% |
Similar Demographics by Hearing Disability
Demographics Similar to Nonimmigrants by Hearing Disability
In terms of hearing disability, the demographic groups most similar to Nonimmigrants are Basque (3.6%, a difference of 0.39%), Slovak (3.6%, a difference of 0.65%), Danish (3.6%, a difference of 0.70%), French American Indian (3.6%, a difference of 0.72%), and Scandinavian (3.6%, a difference of 0.78%).
| Demographics | Rating | Rank | Hearing Disability |
| Europeans | 0.1 /100 | #270 | Tragic 3.5% |
| Czechs | 0.1 /100 | #271 | Tragic 3.5% |
| Fijians | 0.0 /100 | #272 | Tragic 3.5% |
| Puerto Ricans | 0.0 /100 | #273 | Tragic 3.5% |
| Swiss | 0.0 /100 | #274 | Tragic 3.5% |
| Czechoslovakians | 0.0 /100 | #275 | Tragic 3.6% |
| Danes | 0.0 /100 | #276 | Tragic 3.6% |
| Immigrants | Nonimmigrants | 0.0 /100 | #277 | Tragic 3.6% |
| Basques | 0.0 /100 | #278 | Tragic 3.6% |
| Slovaks | 0.0 /100 | #279 | Tragic 3.6% |
| French American Indians | 0.0 /100 | #280 | Tragic 3.6% |
| Scandinavians | 0.0 /100 | #281 | Tragic 3.6% |
| Swedes | 0.0 /100 | #282 | Tragic 3.6% |
| Blackfeet | 0.0 /100 | #283 | Tragic 3.6% |
| Immigrants | Micronesia | 0.0 /100 | #284 | Tragic 3.6% |
Demographics Similar to Puget Sound Salish by Hearing Disability
In terms of hearing disability, the demographic groups most similar to Puget Sound Salish are Yakama (3.9%, a difference of 0.010%), Hopi (3.9%, a difference of 0.18%), Spanish American (4.0%, a difference of 0.20%), Cajun (3.9%, a difference of 0.29%), and Comanche (4.0%, a difference of 0.33%).
| Demographics | Rating | Rank | Hearing Disability |
| Ottawa | 0.0 /100 | #308 | Tragic 3.8% |
| Scotch-Irish | 0.0 /100 | #309 | Tragic 3.8% |
| Cree | 0.0 /100 | #310 | Tragic 3.8% |
| Americans | 0.0 /100 | #311 | Tragic 3.9% |
| Cajuns | 0.0 /100 | #312 | Tragic 3.9% |
| Hopi | 0.0 /100 | #313 | Tragic 3.9% |
| Yakama | 0.0 /100 | #314 | Tragic 3.9% |
| Puget Sound Salish | 0.0 /100 | #315 | Tragic 3.9% |
| Spanish Americans | 0.0 /100 | #316 | Tragic 4.0% |
| Comanche | 0.0 /100 | #317 | Tragic 4.0% |
| Cheyenne | 0.0 /100 | #318 | Tragic 4.0% |
| Chippewa | 0.0 /100 | #319 | Tragic 4.0% |
| Shoshone | 0.0 /100 | #320 | Tragic 4.0% |
| Paiute | 0.0 /100 | #321 | Tragic 4.1% |
| Seminole | 0.0 /100 | #322 | Tragic 4.1% |