Nonimmigrants vs Immigrants from Morocco 10th Grade
COMPARE
Nonimmigrants
Immigrants from Morocco
10th Grade
10th Grade Comparison
Nonimmigrants
Immigrants from Morocco
94.1%
10TH GRADE
83.8/ 100
METRIC RATING
145th/ 347
METRIC RANK
93.5%
10TH GRADE
26.9/ 100
METRIC RATING
194th/ 347
METRIC RANK
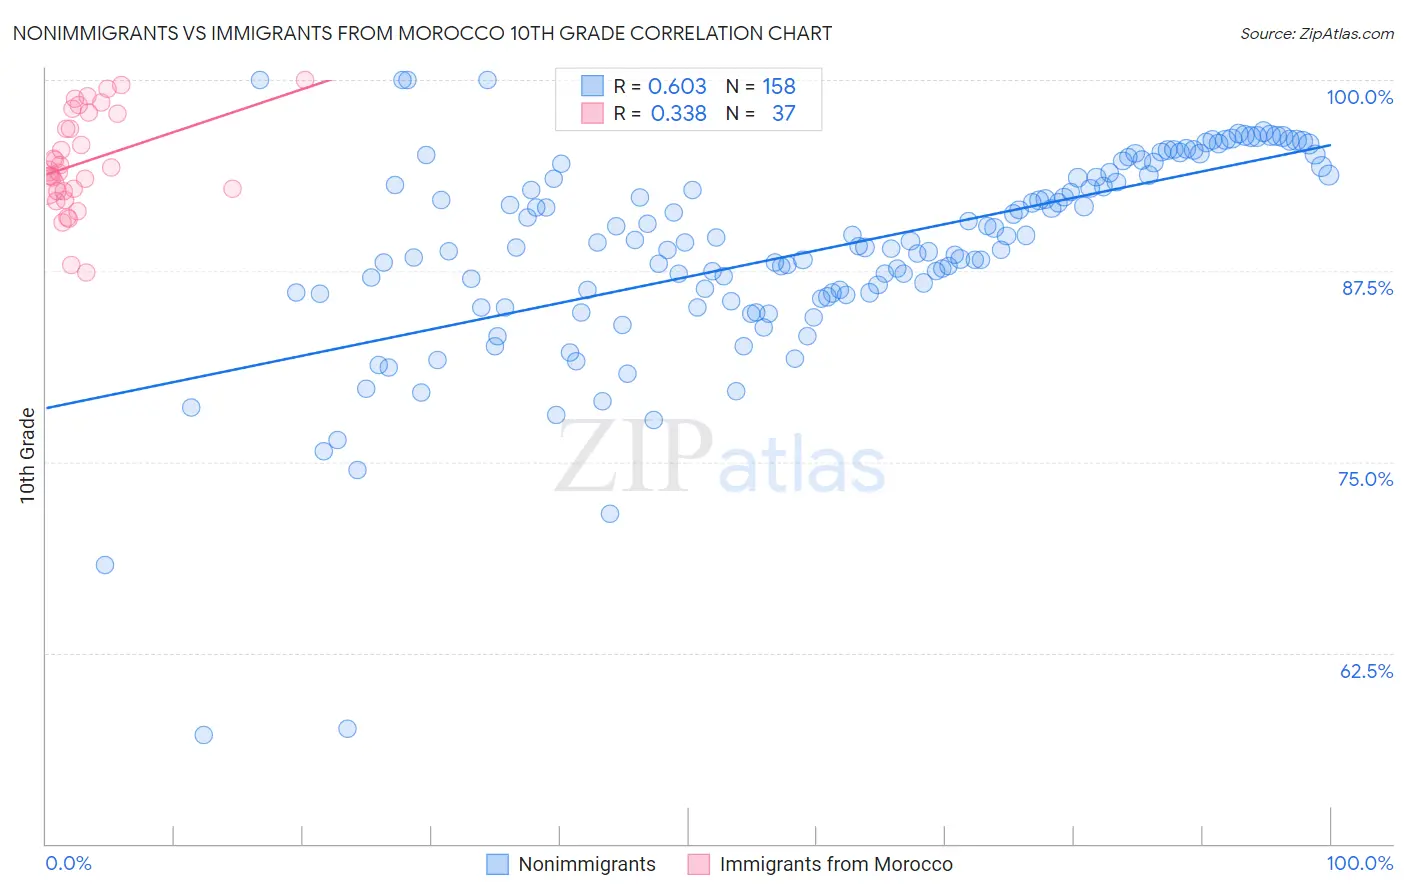
Nonimmigrants vs Immigrants from Morocco 10th Grade Correlation Chart
The statistical analysis conducted on geographies consisting of 585,371,970 people shows a significant positive correlation between the proportion of Nonimmigrants and percentage of population with at least 10th grade education in the United States with a correlation coefficient (R) of 0.603 and weighted average of 94.1%. Similarly, the statistical analysis conducted on geographies consisting of 178,912,438 people shows a mild positive correlation between the proportion of Immigrants from Morocco and percentage of population with at least 10th grade education in the United States with a correlation coefficient (R) of 0.338 and weighted average of 93.5%, a difference of 0.59%.
10th Grade Correlation Summary
| Measurement | Nonimmigrants | Immigrants from Morocco |
| Minimum | 57.2% | 87.4% |
| Maximum | 100.0% | 100.0% |
| Range | 42.8% | 12.6% |
| Mean | 88.9% | 94.6% |
| Median | 89.2% | 94.0% |
| Interquartile 25% (IQ1) | 86.0% | 92.7% |
| Interquartile 75% (IQ3) | 93.8% | 97.8% |
| Interquartile Range (IQR) | 7.8% | 5.1% |
| Standard Deviation (Sample) | 6.8% | 3.2% |
| Standard Deviation (Population) | 6.8% | 3.2% |
Similar Demographics by 10th Grade
Demographics Similar to Nonimmigrants by 10th Grade
In terms of 10th grade, the demographic groups most similar to Nonimmigrants are Cherokee (94.1%, a difference of 0.020%), Immigrants from Kazakhstan (94.1%, a difference of 0.020%), Chickasaw (94.1%, a difference of 0.020%), Immigrants from Ukraine (94.0%, a difference of 0.040%), and Arab (94.0%, a difference of 0.040%).
| Demographics | Rating | Rank | 10th Grade |
| Immigrants | Sri Lanka | 89.9 /100 | #138 | Excellent 94.2% |
| Immigrants | Bosnia and Herzegovina | 89.4 /100 | #139 | Excellent 94.2% |
| Immigrants | Jordan | 87.6 /100 | #140 | Excellent 94.1% |
| Hmong | 86.6 /100 | #141 | Excellent 94.1% |
| Albanians | 86.5 /100 | #142 | Excellent 94.1% |
| Cherokee | 84.9 /100 | #143 | Excellent 94.1% |
| Immigrants | Kazakhstan | 84.9 /100 | #144 | Excellent 94.1% |
| Immigrants | Nonimmigrants | 83.8 /100 | #145 | Excellent 94.1% |
| Chickasaw | 82.6 /100 | #146 | Excellent 94.1% |
| Immigrants | Ukraine | 81.5 /100 | #147 | Excellent 94.0% |
| Arabs | 80.9 /100 | #148 | Excellent 94.0% |
| Ugandans | 80.7 /100 | #149 | Excellent 94.0% |
| Egyptians | 79.6 /100 | #150 | Good 94.0% |
| Kenyans | 79.1 /100 | #151 | Good 94.0% |
| Immigrants | Italy | 78.0 /100 | #152 | Good 94.0% |
Demographics Similar to Immigrants from Morocco by 10th Grade
In terms of 10th grade, the demographic groups most similar to Immigrants from Morocco are Cheyenne (93.5%, a difference of 0.0%), Immigrants from Malaysia (93.5%, a difference of 0.010%), Panamanian (93.5%, a difference of 0.010%), Moroccan (93.5%, a difference of 0.020%), and Pueblo (93.5%, a difference of 0.040%).
| Demographics | Rating | Rank | 10th Grade |
| Liberians | 34.7 /100 | #187 | Fair 93.6% |
| Marshallese | 33.2 /100 | #188 | Fair 93.6% |
| Immigrants | Pakistan | 32.5 /100 | #189 | Fair 93.6% |
| Laotians | 32.1 /100 | #190 | Fair 93.6% |
| Yup'ik | 31.1 /100 | #191 | Fair 93.6% |
| Immigrants | Malaysia | 28.0 /100 | #192 | Fair 93.5% |
| Panamanians | 28.0 /100 | #193 | Fair 93.5% |
| Immigrants | Morocco | 26.9 /100 | #194 | Fair 93.5% |
| Cheyenne | 26.8 /100 | #195 | Fair 93.5% |
| Moroccans | 25.3 /100 | #196 | Fair 93.5% |
| Pueblo | 23.9 /100 | #197 | Fair 93.5% |
| Immigrants | Micronesia | 23.2 /100 | #198 | Fair 93.5% |
| Asians | 23.0 /100 | #199 | Fair 93.5% |
| Hopi | 22.2 /100 | #200 | Fair 93.5% |
| Hawaiians | 21.8 /100 | #201 | Fair 93.5% |