Immigrants from Turkey vs Puget Sound Salish 10th Grade
COMPARE
Immigrants from Turkey
Puget Sound Salish
10th Grade
10th Grade Comparison
Immigrants from Turkey
Puget Sound Salish
94.5%
10TH GRADE
97.4/ 100
METRIC RATING
105th/ 347
METRIC RANK
94.7%
10TH GRADE
99.0/ 100
METRIC RATING
86th/ 347
METRIC RANK
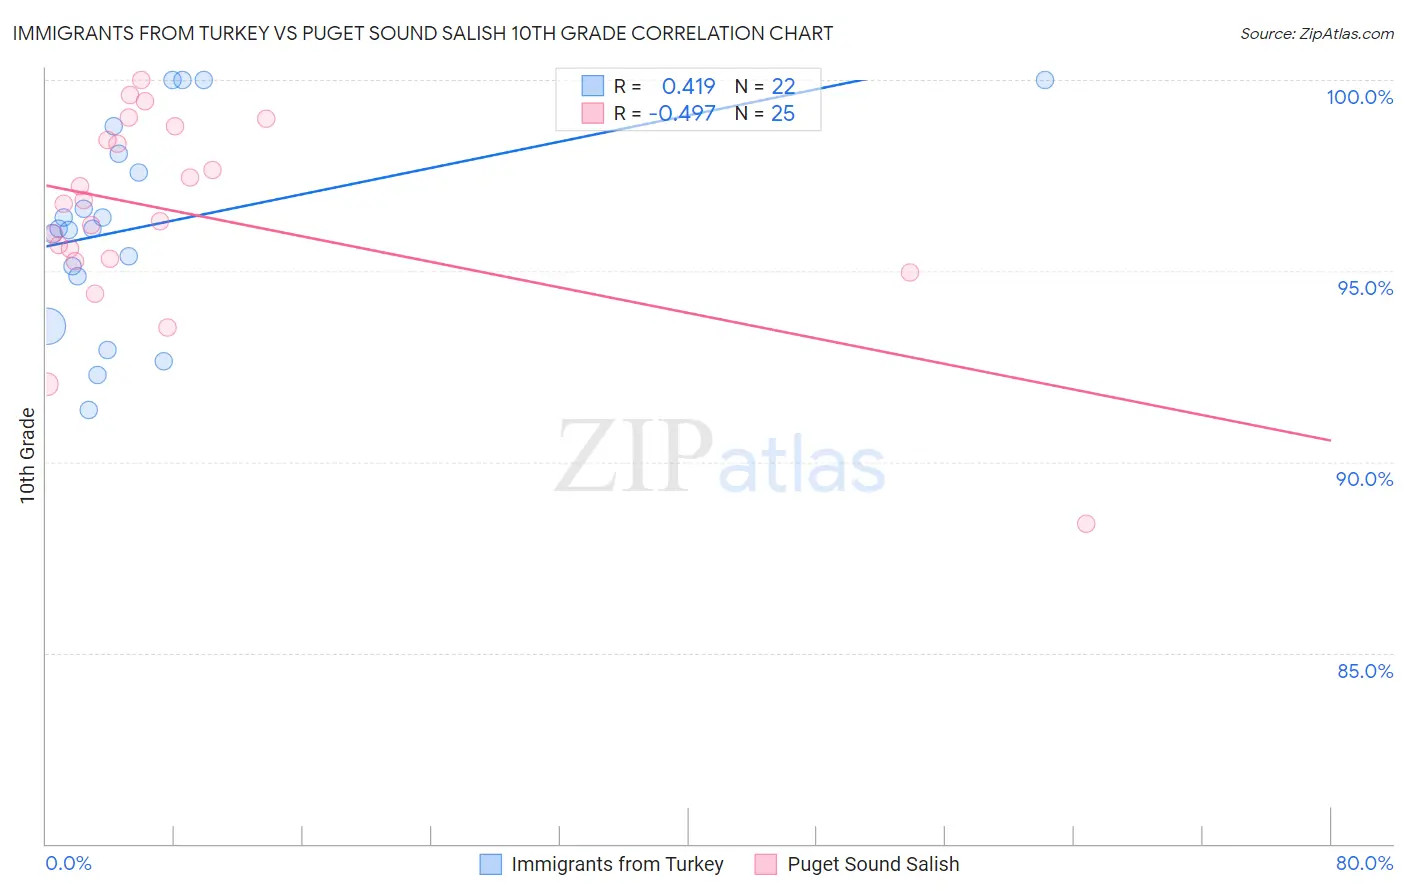
Immigrants from Turkey vs Puget Sound Salish 10th Grade Correlation Chart
The statistical analysis conducted on geographies consisting of 223,057,877 people shows a moderate positive correlation between the proportion of Immigrants from Turkey and percentage of population with at least 10th grade education in the United States with a correlation coefficient (R) of 0.419 and weighted average of 94.5%. Similarly, the statistical analysis conducted on geographies consisting of 46,155,775 people shows a moderate negative correlation between the proportion of Puget Sound Salish and percentage of population with at least 10th grade education in the United States with a correlation coefficient (R) of -0.497 and weighted average of 94.7%, a difference of 0.22%.
10th Grade Correlation Summary
| Measurement | Immigrants from Turkey | Puget Sound Salish |
| Minimum | 91.4% | 88.4% |
| Maximum | 100.0% | 100.0% |
| Range | 8.6% | 11.6% |
| Mean | 96.2% | 96.5% |
| Median | 96.1% | 96.8% |
| Interquartile 25% (IQ1) | 94.9% | 95.3% |
| Interquartile 75% (IQ3) | 98.1% | 98.6% |
| Interquartile Range (IQR) | 3.2% | 3.3% |
| Standard Deviation (Sample) | 2.6% | 2.6% |
| Standard Deviation (Population) | 2.6% | 2.6% |
Demographics Similar to Immigrants from Turkey and Puget Sound Salish by 10th Grade
In terms of 10th grade, the demographic groups most similar to Immigrants from Turkey are Immigrants from Romania (94.5%, a difference of 0.0%), Immigrants from Europe (94.5%, a difference of 0.010%), Cambodian (94.5%, a difference of 0.020%), Immigrants from South Central Asia (94.5%, a difference of 0.030%), and Syrian (94.5%, a difference of 0.030%). Similarly, the demographic groups most similar to Puget Sound Salish are Crow (94.7%, a difference of 0.0%), Immigrants from Saudi Arabia (94.7%, a difference of 0.010%), Immigrants from Japan (94.7%, a difference of 0.010%), Immigrants from Moldova (94.7%, a difference of 0.030%), and South African (94.7%, a difference of 0.040%).
| Demographics | Rating | Rank | 10th Grade |
| Crow | 99.0 /100 | #85 | Exceptional 94.7% |
| Puget Sound Salish | 99.0 /100 | #86 | Exceptional 94.7% |
| Immigrants | Saudi Arabia | 99.0 /100 | #87 | Exceptional 94.7% |
| Immigrants | Japan | 99.0 /100 | #88 | Exceptional 94.7% |
| Immigrants | Moldova | 98.9 /100 | #89 | Exceptional 94.7% |
| South Africans | 98.8 /100 | #90 | Exceptional 94.7% |
| Whites/Caucasians | 98.8 /100 | #91 | Exceptional 94.7% |
| Yugoslavians | 98.4 /100 | #92 | Exceptional 94.6% |
| Soviet Union | 98.3 /100 | #93 | Exceptional 94.6% |
| Immigrants | Germany | 98.3 /100 | #94 | Exceptional 94.6% |
| Menominee | 98.3 /100 | #95 | Exceptional 94.6% |
| Immigrants | Switzerland | 98.3 /100 | #96 | Exceptional 94.6% |
| Lebanese | 98.3 /100 | #97 | Exceptional 94.6% |
| Immigrants | Bulgaria | 98.1 /100 | #98 | Exceptional 94.6% |
| Immigrants | France | 97.9 /100 | #99 | Exceptional 94.5% |
| Immigrants | South Central Asia | 97.8 /100 | #100 | Exceptional 94.5% |
| Syrians | 97.7 /100 | #101 | Exceptional 94.5% |
| Cambodians | 97.6 /100 | #102 | Exceptional 94.5% |
| Immigrants | Europe | 97.5 /100 | #103 | Exceptional 94.5% |
| Immigrants | Romania | 97.5 /100 | #104 | Exceptional 94.5% |
| Immigrants | Turkey | 97.4 /100 | #105 | Exceptional 94.5% |