Nonimmigrants vs Immigrants from Iran College, Under 1 year
COMPARE
Nonimmigrants
Immigrants from Iran
College, Under 1 year
College, Under 1 year Comparison
Nonimmigrants
Immigrants from Iran
62.9%
COLLEGE, UNDER 1 YEAR
3.0/ 100
METRIC RATING
230th/ 347
METRIC RANK
74.3%
COLLEGE, UNDER 1 YEAR
100.0/ 100
METRIC RATING
5th/ 347
METRIC RANK
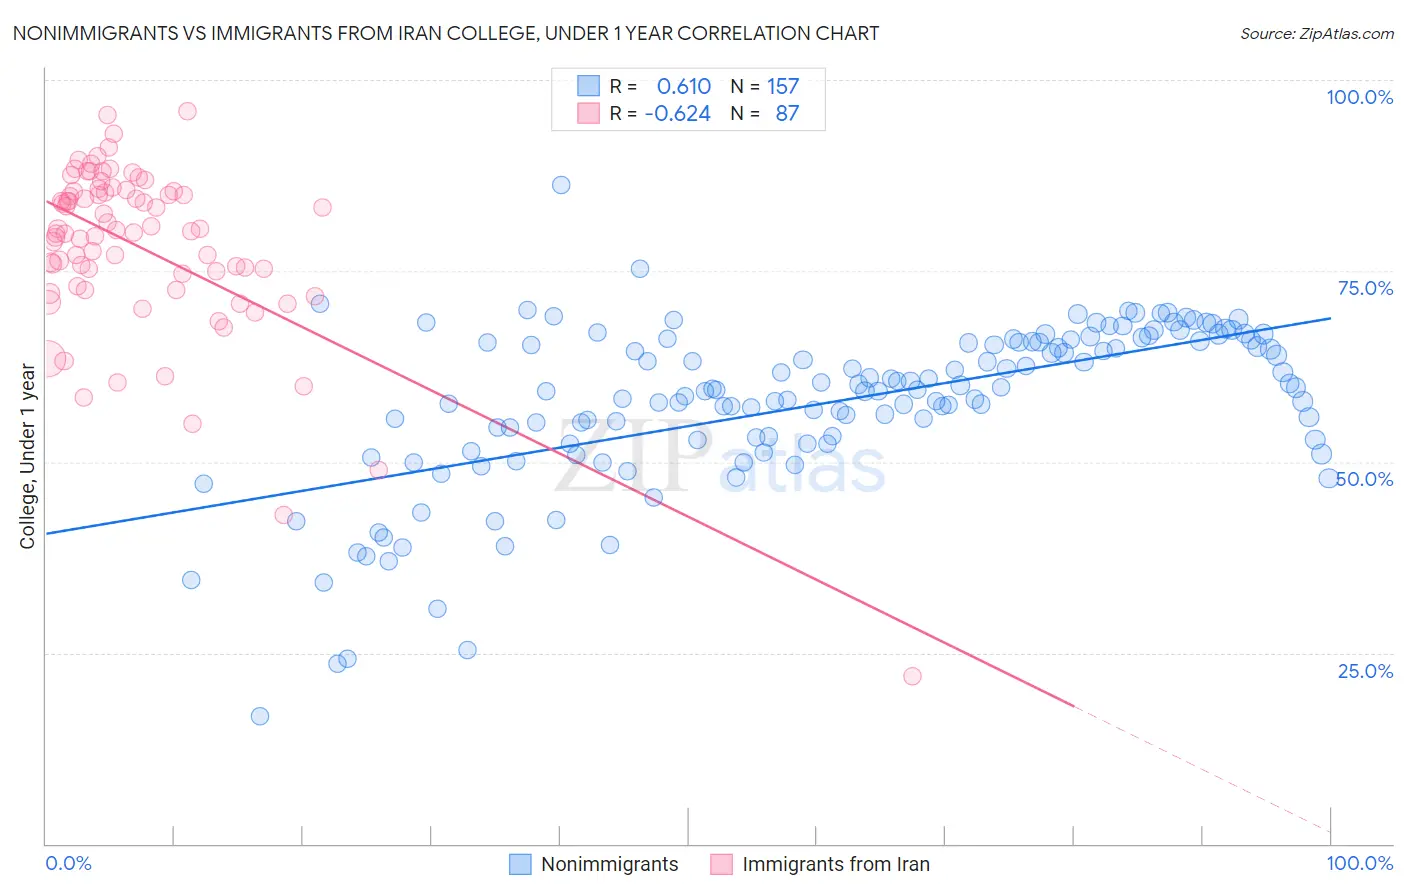
Nonimmigrants vs Immigrants from Iran College, Under 1 year Correlation Chart
The statistical analysis conducted on geographies consisting of 585,317,870 people shows a significant positive correlation between the proportion of Nonimmigrants and percentage of population with at least college, under 1 year education in the United States with a correlation coefficient (R) of 0.610 and weighted average of 62.9%. Similarly, the statistical analysis conducted on geographies consisting of 279,905,207 people shows a significant negative correlation between the proportion of Immigrants from Iran and percentage of population with at least college, under 1 year education in the United States with a correlation coefficient (R) of -0.624 and weighted average of 74.3%, a difference of 18.0%.
College, Under 1 year Correlation Summary
| Measurement | Nonimmigrants | Immigrants from Iran |
| Minimum | 16.7% | 22.0% |
| Maximum | 86.3% | 96.0% |
| Range | 69.6% | 74.0% |
| Mean | 57.6% | 78.0% |
| Median | 59.4% | 80.1% |
| Interquartile 25% (IQ1) | 52.7% | 73.1% |
| Interquartile 75% (IQ3) | 65.7% | 85.5% |
| Interquartile Range (IQR) | 13.0% | 12.4% |
| Standard Deviation (Sample) | 10.8% | 11.6% |
| Standard Deviation (Population) | 10.8% | 11.5% |
Similar Demographics by College, Under 1 year
Demographics Similar to Nonimmigrants by College, Under 1 year
In terms of college, under 1 year, the demographic groups most similar to Nonimmigrants are Liberian (63.0%, a difference of 0.070%), Samoan (63.0%, a difference of 0.13%), Immigrants from Ghana (63.1%, a difference of 0.24%), Immigrants from Western Africa (62.8%, a difference of 0.24%), and Immigrants from Colombia (63.1%, a difference of 0.33%).
| Demographics | Rating | Rank | College, Under 1 year |
| Immigrants | Costa Rica | 4.5 /100 | #223 | Tragic 63.2% |
| Sub-Saharan Africans | 4.4 /100 | #224 | Tragic 63.2% |
| Immigrants | Peru | 4.0 /100 | #225 | Tragic 63.1% |
| Immigrants | Colombia | 4.0 /100 | #226 | Tragic 63.1% |
| Immigrants | Ghana | 3.7 /100 | #227 | Tragic 63.1% |
| Samoans | 3.3 /100 | #228 | Tragic 63.0% |
| Liberians | 3.2 /100 | #229 | Tragic 63.0% |
| Immigrants | Nonimmigrants | 3.0 /100 | #230 | Tragic 62.9% |
| Immigrants | Western Africa | 2.4 /100 | #231 | Tragic 62.8% |
| Osage | 2.2 /100 | #232 | Tragic 62.7% |
| Iroquois | 2.0 /100 | #233 | Tragic 62.6% |
| Chippewa | 2.0 /100 | #234 | Tragic 62.6% |
| Spanish Americans | 1.9 /100 | #235 | Tragic 62.6% |
| Immigrants | Immigrants | 1.7 /100 | #236 | Tragic 62.5% |
| Immigrants | Burma/Myanmar | 1.6 /100 | #237 | Tragic 62.5% |
Demographics Similar to Immigrants from Iran by College, Under 1 year
In terms of college, under 1 year, the demographic groups most similar to Immigrants from Iran are Immigrants from Taiwan (74.2%, a difference of 0.11%), Immigrants from India (74.4%, a difference of 0.23%), Immigrants from Singapore (74.8%, a difference of 0.74%), Iranian (74.9%, a difference of 0.79%), and Okinawan (73.7%, a difference of 0.80%).
| Demographics | Rating | Rank | College, Under 1 year |
| Filipinos | 100.0 /100 | #1 | Exceptional 75.5% |
| Iranians | 100.0 /100 | #2 | Exceptional 74.9% |
| Immigrants | Singapore | 100.0 /100 | #3 | Exceptional 74.8% |
| Immigrants | India | 100.0 /100 | #4 | Exceptional 74.4% |
| Immigrants | Iran | 100.0 /100 | #5 | Exceptional 74.3% |
| Immigrants | Taiwan | 100.0 /100 | #6 | Exceptional 74.2% |
| Okinawans | 100.0 /100 | #7 | Exceptional 73.7% |
| Thais | 100.0 /100 | #8 | Exceptional 73.4% |
| Immigrants | Australia | 100.0 /100 | #9 | Exceptional 72.7% |
| Immigrants | Israel | 100.0 /100 | #10 | Exceptional 72.3% |
| Immigrants | South Central Asia | 100.0 /100 | #11 | Exceptional 72.1% |
| Immigrants | Sweden | 100.0 /100 | #12 | Exceptional 72.1% |
| Cypriots | 100.0 /100 | #13 | Exceptional 72.0% |
| Cambodians | 100.0 /100 | #14 | Exceptional 71.9% |
| Burmese | 100.0 /100 | #15 | Exceptional 71.9% |