Nonimmigrants vs Asian College, Under 1 year

COMPARE

Nonimmigrants
Race
Ancestry
AfghanAfricanAlaska NativeAlaskan AthabascanAlbanianAleutAlsatianAmericanApacheArabArapahoArgentineanArmenianAssyrian/Chaldean/SyriacAustralianAustrianBahamianBangladeshiBarbadianBasqueBelgianBelizeanBermudanBhutaneseBlackfeetBolivianBrazilianBritishBritish West IndianBulgarianBurmeseCajunCambodianCanadianCape VerdeanCarpatho RusynCelticCentral AmericanCentral American IndianCherokeeCheyenneChickasawChileanChineseChippewaChoctawColombianColvilleComancheCosta RicanCreeCreekCroatianCrowCubanCypriotCzechCzechoslovakianDanishDelawareDominicanDutchDutch West IndianEastern EuropeanEcuadorianEgyptianEnglishEstonianEthiopianEuropeanFijianFilipinoFinnishFrenchFrench American IndianFrench CanadianGermanGerman RussianGhanaianGreekGuamanian/ChamorroGuatemalanGuyaneseHaitianHmongHonduranHopiHoumaHungarianIcelanderIndian (Asian)IndonesianInupiatIranianIraqiIrishIroquoisIsraeliItalianJamaicanJapaneseJordanianKenyanKiowaKoreanLaotianLatvianLebaneseLiberianLithuanianLumbeeLuxembourgerMacedonianMalaysianMalteseMarshalleseMenomineeMexicanMexican American IndianMongolianMoroccanNative HawaiianNavajoNepaleseNew ZealanderNicaraguanNigerianNorthern EuropeanNorwegianOkinawanOsageOttawaPaiutePakistaniPalestinianPanamanianParaguayanPennsylvania GermanPeruvianPimaPolishPortuguesePotawatomiPuebloPuerto RicanPuget Sound SalishRomanianRussianSalvadoranSamoanScandinavianScotch-IrishScottishSeminoleSenegaleseSerbianShoshoneSierra LeoneanSiouxSlavicSlovakSloveneSomaliSouth AfricanSouth AmericanSouth American IndianSoviet UnionSpaniardSpanishSpanish AmericanSpanish American IndianSri LankanSubsaharan AfricanSudaneseSwedishSwissSyrianTaiwaneseThaiTlingit-HaidaTohono O'OdhamTonganTrinidadian and TobagonianTsimshianTurkishU.S. Virgin IslanderUgandanUkrainianUruguayanUteVenezuelanVietnameseWelshWest IndianYakamaYaquiYugoslavianYumanYup'ikZimbabwean
Immigration
NonimmigrantsImmigrantsAfghanistanAfricaAlbaniaArgentinaArmeniaAsiaAustraliaAustriaBahamasBangladeshBarbadosBelarusBelgiumBelizeBoliviaBosnia and HerzegovinaBrazilBulgariaBurma/MyanmarCabo VerdeCambodiaCameroonCanadaCaribbeanCentral AmericaChileChinaColombiaCongoCosta RicaCroatiaCubaCzechoslovakiaDenmarkDominicaDominican RepublicEastern AfricaEastern AsiaEastern EuropeEcuadorEgyptEl SalvadorEnglandEritreaEthiopiaEuropeFijiFranceGermanyGhanaGreeceGrenadaGuatemalaGuyanaHaitiHondurasHong KongHungaryIndiaIndonesiaIranIraqIrelandIsraelItalyJamaicaJapanJordanKazakhstanKenyaKoreaKuwaitLaosLatin AmericaLatviaLebanonLiberiaLithuaniaMalaysiaMexicoMicronesiaMiddle AfricaMoldovaMoroccoNepalNetherlandsNicaraguaNigeriaNorth AmericaNorth MacedoniaNorthern AfricaNorthern EuropeNorwayOceaniaPakistanPanamaPeruPhilippinesPolandPortugalRomaniaRussiaSaudi ArabiaScotlandSenegalSerbiaSierra LeoneSingaporeSomaliaSouth AfricaSouth AmericaSouth Central AsiaSouth Eastern AsiaSouthern EuropeSpainSri LankaSt. Vincent and the GrenadinesSudanSwedenSwitzerlandSyriaTaiwanThailandTrinidad and TobagoTurkeyUgandaUkraineUruguayUzbekistanVenezuelaVietnamWest IndiesWestern AfricaWestern AsiaWestern EuropeYemenZaireZimbabweAzores
Asian
Race
Ancestry
AfghanAfricanAlaska NativeAlaskan AthabascanAlbanianAleutAlsatianAmericanApacheArabArapahoArgentineanArmenianAssyrian/Chaldean/SyriacAustralianAustrianBahamianBangladeshiBarbadianBasqueBelgianBelizeanBermudanBhutaneseBlackfeetBolivianBrazilianBritishBritish West IndianBulgarianBurmeseCajunCambodianCanadianCape VerdeanCarpatho RusynCelticCentral AmericanCentral American IndianCherokeeCheyenneChickasawChileanChineseChippewaChoctawColombianColvilleComancheCosta RicanCreeCreekCroatianCrowCubanCypriotCzechCzechoslovakianDanishDelawareDominicanDutchDutch West IndianEastern EuropeanEcuadorianEgyptianEnglishEstonianEthiopianEuropeanFijianFilipinoFinnishFrenchFrench American IndianFrench CanadianGermanGerman RussianGhanaianGreekGuamanian/ChamorroGuatemalanGuyaneseHaitianHmongHonduranHopiHoumaHungarianIcelanderIndian (Asian)IndonesianInupiatIranianIraqiIrishIroquoisIsraeliItalianJamaicanJapaneseJordanianKenyanKiowaKoreanLaotianLatvianLebaneseLiberianLithuanianLumbeeLuxembourgerMacedonianMalaysianMalteseMarshalleseMenomineeMexicanMexican American IndianMongolianMoroccanNative HawaiianNavajoNepaleseNew ZealanderNicaraguanNigerianNorthern EuropeanNorwegianOkinawanOsageOttawaPaiutePakistaniPalestinianPanamanianParaguayanPennsylvania GermanPeruvianPimaPolishPortuguesePotawatomiPuebloPuerto RicanPuget Sound SalishRomanianRussianSalvadoranSamoanScandinavianScotch-IrishScottishSeminoleSenegaleseSerbianShoshoneSierra LeoneanSiouxSlavicSlovakSloveneSomaliSouth AfricanSouth AmericanSouth American IndianSoviet UnionSpaniardSpanishSpanish AmericanSpanish American IndianSri LankanSubsaharan AfricanSudaneseSwedishSwissSyrianTaiwaneseThaiTlingit-HaidaTohono O'OdhamTonganTrinidadian and TobagonianTsimshianTurkishU.S. Virgin IslanderUgandanUkrainianUruguayanUteVenezuelanVietnameseWelshWest IndianYakamaYaquiYugoslavianYumanYup'ikZimbabwean
Immigration
ImmigrantsAfghanistanAfricaAlbaniaArgentinaArmeniaAsiaAustraliaAustriaBahamasBangladeshBarbadosBelarusBelgiumBelizeBoliviaBosnia and HerzegovinaBrazilBulgariaBurma/MyanmarCabo VerdeCambodiaCameroonCanadaCaribbeanCentral AmericaChileChinaColombiaCongoCosta RicaCroatiaCubaCzechoslovakiaDenmarkDominicaDominican RepublicEastern AfricaEastern AsiaEastern EuropeEcuadorEgyptEl SalvadorEnglandEritreaEthiopiaEuropeFijiFranceGermanyGhanaGreeceGrenadaGuatemalaGuyanaHaitiHondurasHong KongHungaryIndiaIndonesiaIranIraqIrelandIsraelItalyJamaicaJapanJordanKazakhstanKenyaKoreaKuwaitLaosLatin AmericaLatviaLebanonLiberiaLithuaniaMalaysiaMexicoMicronesiaMiddle AfricaMoldovaMoroccoNepalNetherlandsNicaraguaNigeriaNorth AmericaNorth MacedoniaNorthern AfricaNorthern EuropeNorwayOceaniaPakistanPanamaPeruPhilippinesPolandPortugalRomaniaRussiaSaudi ArabiaScotlandSenegalSerbiaSierra LeoneSingaporeSomaliaSouth AfricaSouth AmericaSouth Central AsiaSouth Eastern AsiaSouthern EuropeSpainSri LankaSt. Vincent and the GrenadinesSudanSwedenSwitzerlandSyriaTaiwanThailandTrinidad and TobagoTurkeyUgandaUkraineUruguayUzbekistanVenezuelaVietnamWest IndiesWestern AfricaWestern AsiaWestern EuropeYemenZaireZimbabweAzores
College, Under 1 year
Income
Poverty
Unemployment
Labor Participation
Family Structure
Vehicle Availability
Education Level
Disability

College, Under 1 year Comparison

Nonimmigrants

Asians

Tragic
Exceptional
62.9%
COLLEGE, UNDER 1 YEAR
3.0/ 100
METRIC RATING
230th/ 347
METRIC RANK
69.4%
COLLEGE, UNDER 1 YEAR
99.6/ 100
METRIC RATING
57th/ 347
METRIC RANK

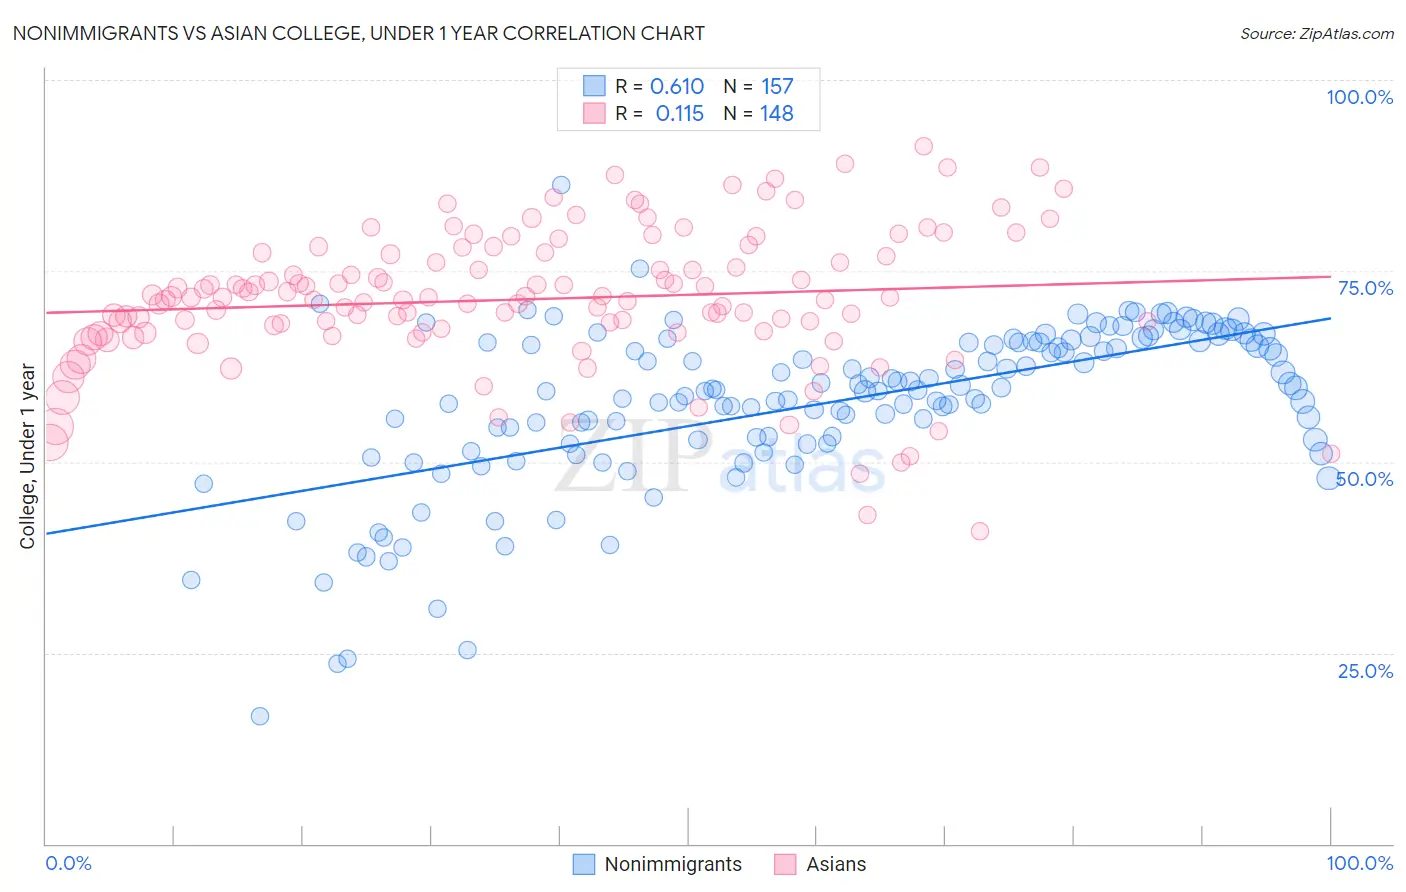
Nonimmigrants vs Asian College, Under 1 year Correlation Chart

The statistical analysis conducted on geographies consisting of 585,317,870 people shows a significant positive correlation between the proportion of Nonimmigrants and percentage of population with at least college, under 1 year education in the United States with a correlation coefficient (R) of 0.610 and weighted average of 62.9%. Similarly, the statistical analysis conducted on geographies consisting of 550,912,370 people shows a poor positive correlation between the proportion of Asians and percentage of population with at least college, under 1 year education in the United States with a correlation coefficient (R) of 0.115 and weighted average of 69.4%, a difference of 10.3%.
Nonimmigrants vs Asian College, Under 1 year

College, Under 1 year Correlation Summary

MeasurementNonimmigrantsAsian
Minimum16.7%40.9%
Maximum86.3%91.3%
Range69.6%50.4%
Mean57.6%71.3%
Median59.4%71.5%
Interquartile 25% (IQ1)52.7%67.0%
Interquartile 75% (IQ3)65.7%77.3%
Interquartile Range (IQR)13.0%10.3%
Standard Deviation (Sample)10.8%9.2%
Standard Deviation (Population)10.8%9.1%

Similar Demographics by College, Under 1 year

Demographics Similar to Nonimmigrants by College, Under 1 year

In terms of college, under 1 year, the demographic groups most similar to Nonimmigrants are Liberian (63.0%, a difference of 0.070%), Samoan (63.0%, a difference of 0.13%), Immigrants from Ghana (63.1%, a difference of 0.24%), Immigrants from Western Africa (62.8%, a difference of 0.24%), and Immigrants from Colombia (63.1%, a difference of 0.33%).
DemographicsRating | RankCollege, Under 1 year
Immigrants | Costa Rica
4.5
/100
|
#223
Tragic
63.2%
Sub-Saharan Africans
4.4
/100
|
#224
Tragic
63.2%
Immigrants | Peru
4.0
/100
|
#225
Tragic
63.1%
Immigrants | Colombia
4.0
/100
|
#226
Tragic
63.1%
Immigrants | Ghana
3.7
/100
|
#227
Tragic
63.1%
Samoans
3.3
/100
|
#228
Tragic
63.0%
Liberians
3.2
/100
|
#229
Tragic
63.0%
Immigrants | Nonimmigrants
3.0
/100
|
#230
Tragic
62.9%
Immigrants | Western Africa
2.4
/100
|
#231
Tragic
62.8%
Osage
2.2
/100
|
#232
Tragic
62.7%
Iroquois
2.0
/100
|
#233
Tragic
62.6%
Chippewa
2.0
/100
|
#234
Tragic
62.6%
Spanish Americans
1.9
/100
|
#235
Tragic
62.6%
Immigrants | Immigrants
1.7
/100
|
#236
Tragic
62.5%
Immigrants | Burma/Myanmar
1.6
/100
|
#237
Tragic
62.5%

Demographics Similar to Asians by College, Under 1 year

In terms of college, under 1 year, the demographic groups most similar to Asians are Immigrants from Scotland (69.4%, a difference of 0.020%), Immigrants from Malaysia (69.3%, a difference of 0.10%), Maltese (69.5%, a difference of 0.14%), Immigrants from Serbia (69.3%, a difference of 0.23%), and Immigrants from Czechoslovakia (69.6%, a difference of 0.25%).
DemographicsRating | RankCollege, Under 1 year
Zimbabweans
99.8
/100
|
#50
Exceptional
69.9%
Mongolians
99.8
/100
|
#51
Exceptional
69.9%
Immigrants | Russia
99.8
/100
|
#52
Exceptional
69.9%
South Africans
99.7
/100
|
#53
Exceptional
69.7%
Immigrants | Czechoslovakia
99.7
/100
|
#54
Exceptional
69.6%
Maltese
99.7
/100
|
#55
Exceptional
69.5%
Immigrants | Scotland
99.6
/100
|
#56
Exceptional
69.4%
Asians
99.6
/100
|
#57
Exceptional
69.4%
Immigrants | Malaysia
99.6
/100
|
#58
Exceptional
69.3%
Immigrants | Serbia
99.5
/100
|
#59
Exceptional
69.3%
Immigrants | Asia
99.5
/100
|
#60
Exceptional
69.2%
Immigrants | Kazakhstan
99.5
/100
|
#61
Exceptional
69.2%
Immigrants | Belarus
99.5
/100
|
#62
Exceptional
69.2%
Immigrants | Canada
99.4
/100
|
#63
Exceptional
69.1%
Northern Europeans
99.4
/100
|
#64
Exceptional
69.0%