Immigrants from Micronesia vs South American Indian College, Under 1 year
COMPARE
Immigrants from Micronesia
South American Indian
College, Under 1 year
College, Under 1 year Comparison
Immigrants from Micronesia
South American Indians
61.5%
COLLEGE, UNDER 1 YEAR
0.5/ 100
METRIC RATING
251st/ 347
METRIC RANK
65.5%
COLLEGE, UNDER 1 YEAR
54.4/ 100
METRIC RATING
172nd/ 347
METRIC RANK
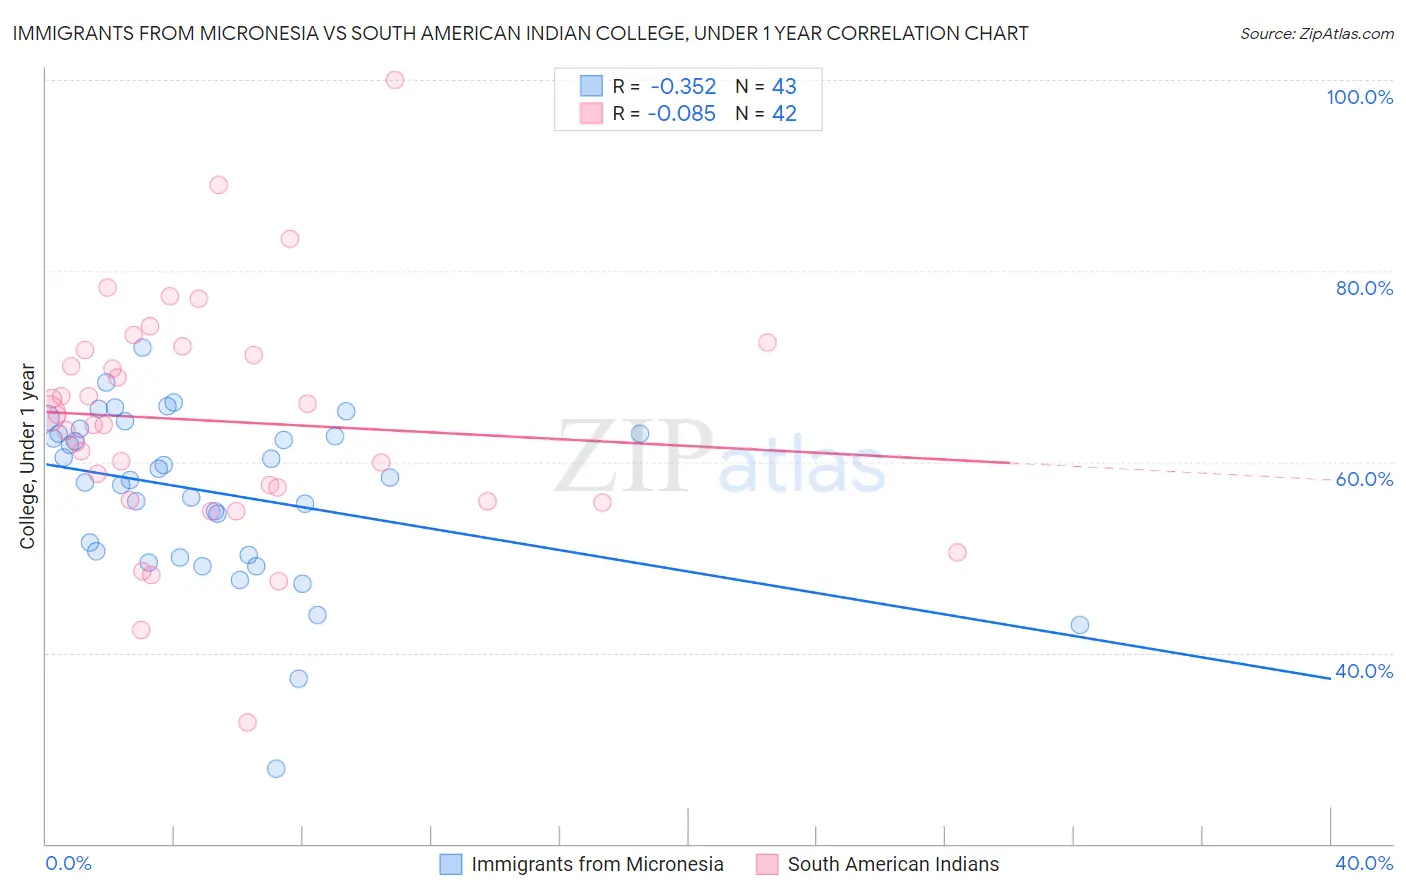
Immigrants from Micronesia vs South American Indian College, Under 1 year Correlation Chart
The statistical analysis conducted on geographies consisting of 61,608,832 people shows a mild negative correlation between the proportion of Immigrants from Micronesia and percentage of population with at least college, under 1 year education in the United States with a correlation coefficient (R) of -0.352 and weighted average of 61.5%. Similarly, the statistical analysis conducted on geographies consisting of 164,573,280 people shows a slight negative correlation between the proportion of South American Indians and percentage of population with at least college, under 1 year education in the United States with a correlation coefficient (R) of -0.085 and weighted average of 65.5%, a difference of 6.5%.
College, Under 1 year Correlation Summary
| Measurement | Immigrants from Micronesia | South American Indian |
| Minimum | 27.9% | 32.7% |
| Maximum | 72.0% | 100.0% |
| Range | 44.1% | 67.3% |
| Mean | 56.9% | 64.3% |
| Median | 58.3% | 64.4% |
| Interquartile 25% (IQ1) | 50.3% | 56.0% |
| Interquartile 75% (IQ3) | 63.0% | 71.7% |
| Interquartile Range (IQR) | 12.7% | 15.7% |
| Standard Deviation (Sample) | 8.8% | 12.4% |
| Standard Deviation (Population) | 8.7% | 12.3% |
Similar Demographics by College, Under 1 year
Demographics Similar to Immigrants from Micronesia by College, Under 1 year
In terms of college, under 1 year, the demographic groups most similar to Immigrants from Micronesia are West Indian (61.5%, a difference of 0.11%), Japanese (61.5%, a difference of 0.11%), Immigrants from Cambodia (61.5%, a difference of 0.11%), Vietnamese (61.7%, a difference of 0.19%), and Immigrants from Congo (61.7%, a difference of 0.19%).
| Demographics | Rating | Rank | College, Under 1 year |
| Colville | 1.0 /100 | #244 | Tragic 62.1% |
| Delaware | 0.9 /100 | #245 | Tragic 62.1% |
| Marshallese | 0.8 /100 | #246 | Tragic 61.9% |
| Immigrants | Liberia | 0.8 /100 | #247 | Tragic 61.9% |
| Potawatomi | 0.6 /100 | #248 | Tragic 61.8% |
| Vietnamese | 0.5 /100 | #249 | Tragic 61.7% |
| Immigrants | Congo | 0.5 /100 | #250 | Tragic 61.7% |
| Immigrants | Micronesia | 0.5 /100 | #251 | Tragic 61.5% |
| West Indians | 0.4 /100 | #252 | Tragic 61.5% |
| Japanese | 0.4 /100 | #253 | Tragic 61.5% |
| Immigrants | Cambodia | 0.4 /100 | #254 | Tragic 61.5% |
| Comanche | 0.4 /100 | #255 | Tragic 61.4% |
| Bangladeshis | 0.4 /100 | #256 | Tragic 61.4% |
| Immigrants | Laos | 0.3 /100 | #257 | Tragic 61.3% |
| Immigrants | Bangladesh | 0.3 /100 | #258 | Tragic 61.3% |
Demographics Similar to South American Indians by College, Under 1 year
In terms of college, under 1 year, the demographic groups most similar to South American Indians are Swiss (65.5%, a difference of 0.020%), Immigrants from Oceania (65.6%, a difference of 0.030%), Yugoslavian (65.6%, a difference of 0.060%), German (65.6%, a difference of 0.060%), and Hungarian (65.6%, a difference of 0.070%).
| Demographics | Rating | Rank | College, Under 1 year |
| Immigrants | Uzbekistan | 61.6 /100 | #165 | Good 65.8% |
| Moroccans | 56.7 /100 | #166 | Average 65.6% |
| Immigrants | Somalia | 56.4 /100 | #167 | Average 65.6% |
| Hungarians | 55.9 /100 | #168 | Average 65.6% |
| Yugoslavians | 55.7 /100 | #169 | Average 65.6% |
| Germans | 55.7 /100 | #170 | Average 65.6% |
| Immigrants | Oceania | 55.0 /100 | #171 | Average 65.6% |
| South American Indians | 54.4 /100 | #172 | Average 65.5% |
| Swiss | 53.9 /100 | #173 | Average 65.5% |
| Immigrants | Bosnia and Herzegovina | 50.0 /100 | #174 | Average 65.4% |
| Scotch-Irish | 49.5 /100 | #175 | Average 65.4% |
| French | 48.9 /100 | #176 | Average 65.4% |
| Immigrants | North Macedonia | 48.6 /100 | #177 | Average 65.4% |
| German Russians | 48.3 /100 | #178 | Average 65.4% |
| Guamanians/Chamorros | 48.2 /100 | #179 | Average 65.4% |