Belgian vs Immigrants from Latvia Doctorate Degree
COMPARE
Belgian
Immigrants from Latvia
Doctorate Degree
Doctorate Degree Comparison
Belgians
Immigrants from Latvia
1.8%
DOCTORATE DEGREE
50.3/ 100
METRIC RATING
172nd/ 347
METRIC RANK
2.4%
DOCTORATE DEGREE
100.0/ 100
METRIC RATING
53rd/ 347
METRIC RANK
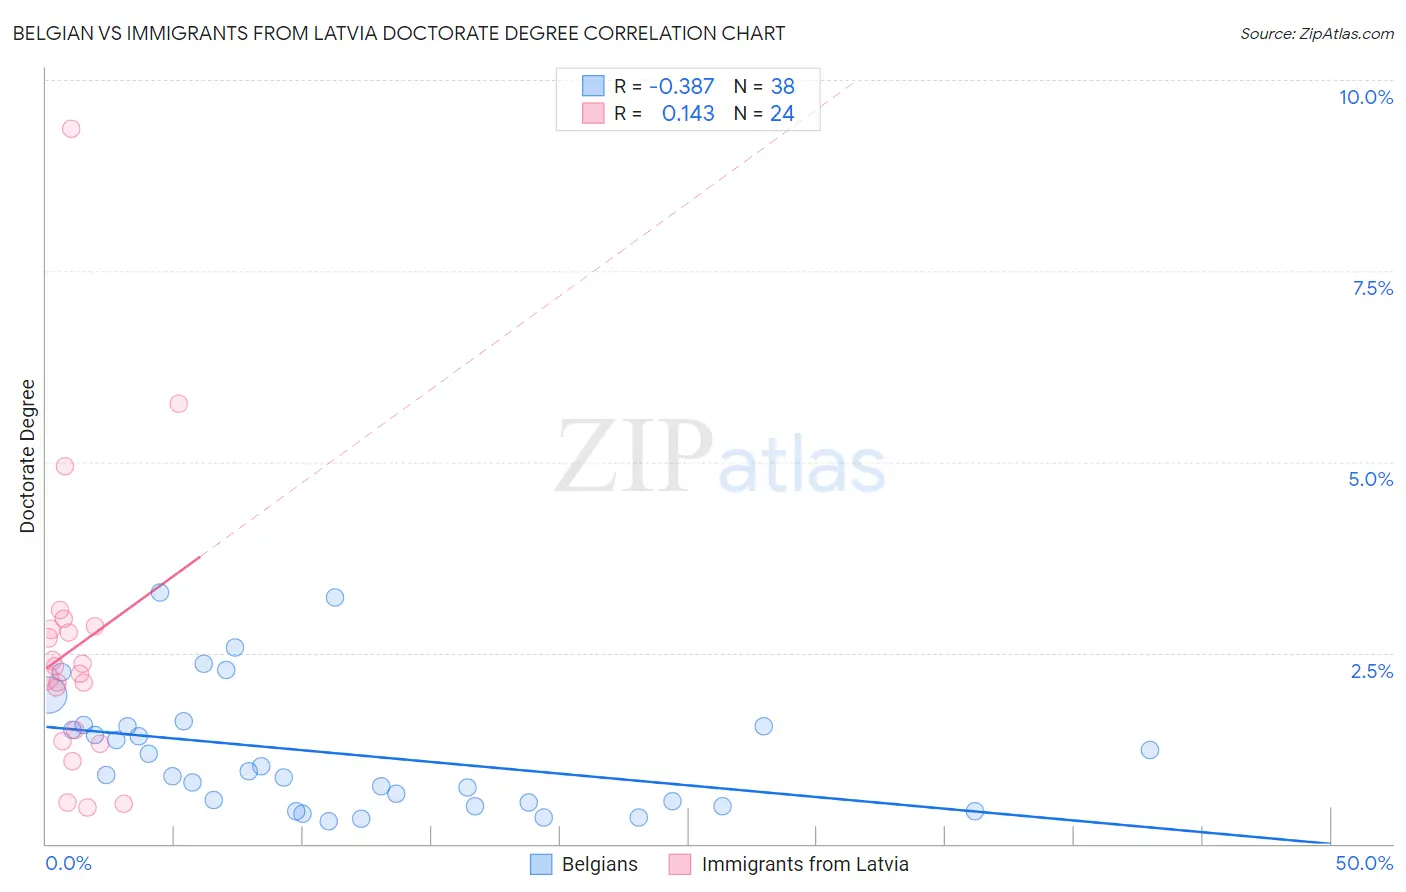
Belgian vs Immigrants from Latvia Doctorate Degree Correlation Chart
The statistical analysis conducted on geographies consisting of 351,946,706 people shows a mild negative correlation between the proportion of Belgians and percentage of population with at least doctorate degree education in the United States with a correlation coefficient (R) of -0.387 and weighted average of 1.8%. Similarly, the statistical analysis conducted on geographies consisting of 113,595,553 people shows a poor positive correlation between the proportion of Immigrants from Latvia and percentage of population with at least doctorate degree education in the United States with a correlation coefficient (R) of 0.143 and weighted average of 2.4%, a difference of 29.5%.
Doctorate Degree Correlation Summary
| Measurement | Belgian | Immigrants from Latvia |
| Minimum | 0.30% | 0.48% |
| Maximum | 3.3% | 9.4% |
| Range | 3.0% | 8.9% |
| Mean | 1.2% | 2.6% |
| Median | 0.93% | 2.3% |
| Interquartile 25% (IQ1) | 0.53% | 1.4% |
| Interquartile 75% (IQ3) | 1.5% | 2.8% |
| Interquartile Range (IQR) | 1.0% | 1.4% |
| Standard Deviation (Sample) | 0.80% | 1.9% |
| Standard Deviation (Population) | 0.79% | 1.9% |
Similar Demographics by Doctorate Degree
Demographics Similar to Belgians by Doctorate Degree
In terms of doctorate degree, the demographic groups most similar to Belgians are Norwegian (1.8%, a difference of 0.040%), Immigrants from Bangladesh (1.8%, a difference of 0.040%), Immigrants from Thailand (1.8%, a difference of 0.12%), Spanish (1.8%, a difference of 0.14%), and Iraqi (1.8%, a difference of 0.15%).
| Demographics | Rating | Rank | Doctorate Degree |
| Scotch-Irish | 63.6 /100 | #165 | Good 1.9% |
| Spaniards | 63.5 /100 | #166 | Good 1.9% |
| Macedonians | 60.9 /100 | #167 | Good 1.9% |
| Sri Lankans | 60.3 /100 | #168 | Good 1.9% |
| Vietnamese | 54.8 /100 | #169 | Average 1.9% |
| Costa Ricans | 53.3 /100 | #170 | Average 1.8% |
| Bermudans | 52.1 /100 | #171 | Average 1.8% |
| Belgians | 50.3 /100 | #172 | Average 1.8% |
| Norwegians | 50.0 /100 | #173 | Average 1.8% |
| Immigrants | Bangladesh | 50.0 /100 | #174 | Average 1.8% |
| Immigrants | Thailand | 49.4 /100 | #175 | Average 1.8% |
| Spanish | 49.3 /100 | #176 | Average 1.8% |
| Iraqis | 49.2 /100 | #177 | Average 1.8% |
| French | 48.8 /100 | #178 | Average 1.8% |
| Ghanaians | 48.3 /100 | #179 | Average 1.8% |
Demographics Similar to Immigrants from Latvia by Doctorate Degree
In terms of doctorate degree, the demographic groups most similar to Immigrants from Latvia are Bulgarian (2.4%, a difference of 0.12%), Australian (2.4%, a difference of 0.59%), Immigrants from Norway (2.4%, a difference of 0.68%), Immigrants from Indonesia (2.4%, a difference of 0.68%), and Bolivian (2.4%, a difference of 0.76%).
| Demographics | Rating | Rank | Doctorate Degree |
| Immigrants | Austria | 100.0 /100 | #46 | Exceptional 2.4% |
| Immigrants | Western Europe | 100.0 /100 | #47 | Exceptional 2.4% |
| Asians | 100.0 /100 | #48 | Exceptional 2.4% |
| Immigrants | Asia | 100.0 /100 | #49 | Exceptional 2.4% |
| Immigrants | Norway | 100.0 /100 | #50 | Exceptional 2.4% |
| Australians | 100.0 /100 | #51 | Exceptional 2.4% |
| Bulgarians | 100.0 /100 | #52 | Exceptional 2.4% |
| Immigrants | Latvia | 100.0 /100 | #53 | Exceptional 2.4% |
| Immigrants | Indonesia | 100.0 /100 | #54 | Exceptional 2.4% |
| Bolivians | 100.0 /100 | #55 | Exceptional 2.4% |
| Immigrants | Czechoslovakia | 100.0 /100 | #56 | Exceptional 2.4% |
| Immigrants | Ethiopia | 100.0 /100 | #57 | Exceptional 2.4% |
| Ethiopians | 99.9 /100 | #58 | Exceptional 2.3% |
| South Africans | 99.9 /100 | #59 | Exceptional 2.3% |
| Immigrants | Serbia | 99.9 /100 | #60 | Exceptional 2.3% |