Immigrants from Indonesia vs Immigrants from Latvia Doctorate Degree
COMPARE
Immigrants from Indonesia
Immigrants from Latvia
Doctorate Degree
Doctorate Degree Comparison
Immigrants from Indonesia
Immigrants from Latvia
2.4%
DOCTORATE DEGREE
100.0/ 100
METRIC RATING
54th/ 347
METRIC RANK
2.4%
DOCTORATE DEGREE
100.0/ 100
METRIC RATING
53rd/ 347
METRIC RANK
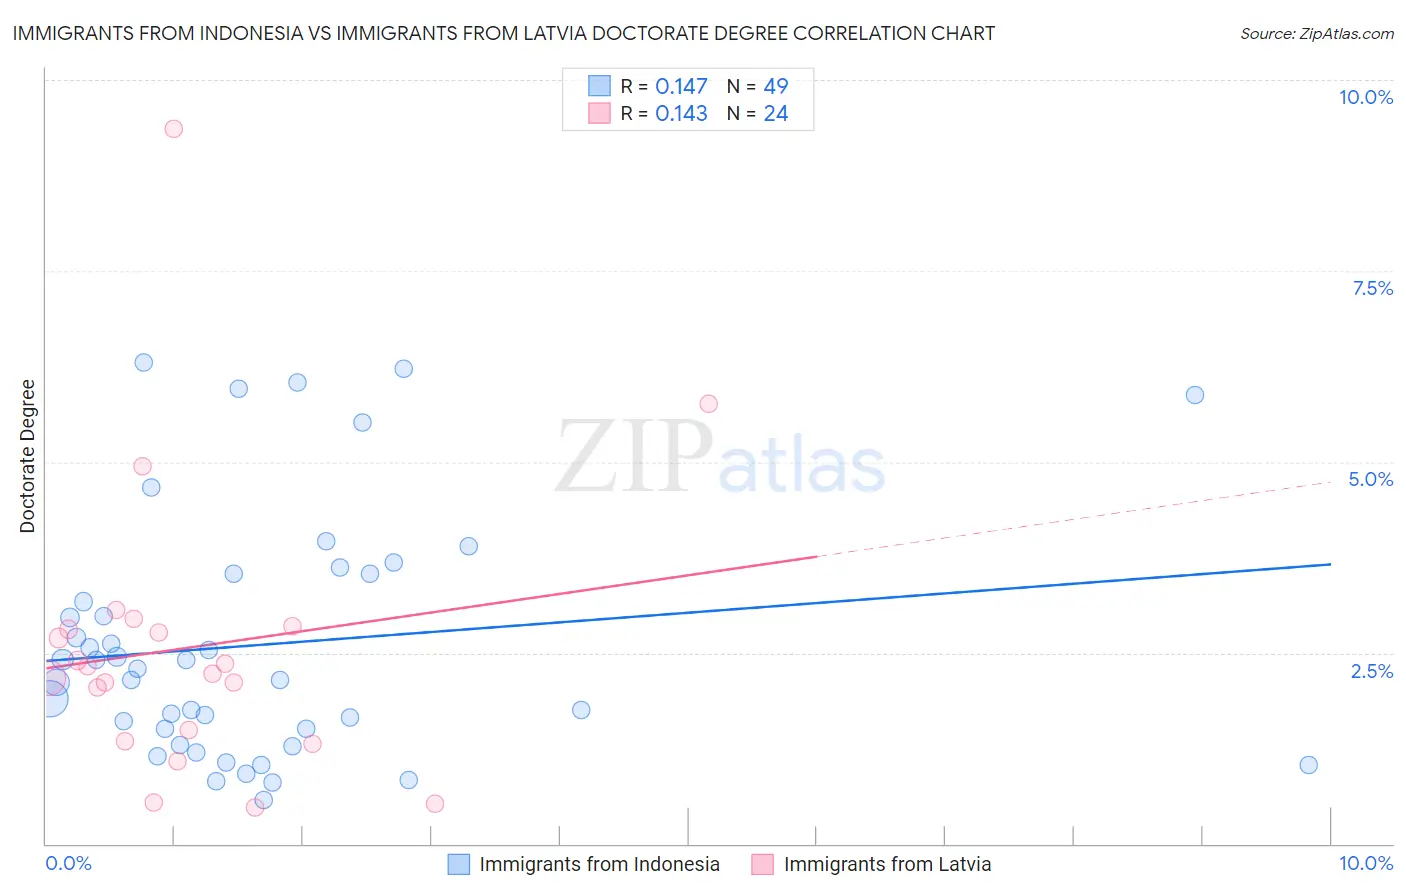
Immigrants from Indonesia vs Immigrants from Latvia Doctorate Degree Correlation Chart
The statistical analysis conducted on geographies consisting of 215,315,104 people shows a poor positive correlation between the proportion of Immigrants from Indonesia and percentage of population with at least doctorate degree education in the United States with a correlation coefficient (R) of 0.147 and weighted average of 2.4%. Similarly, the statistical analysis conducted on geographies consisting of 113,595,553 people shows a poor positive correlation between the proportion of Immigrants from Latvia and percentage of population with at least doctorate degree education in the United States with a correlation coefficient (R) of 0.143 and weighted average of 2.4%, a difference of 0.68%.
Doctorate Degree Correlation Summary
| Measurement | Immigrants from Indonesia | Immigrants from Latvia |
| Minimum | 0.57% | 0.48% |
| Maximum | 6.3% | 9.4% |
| Range | 5.7% | 8.9% |
| Mean | 2.6% | 2.6% |
| Median | 2.3% | 2.3% |
| Interquartile 25% (IQ1) | 1.4% | 1.4% |
| Interquartile 75% (IQ3) | 3.5% | 2.8% |
| Interquartile Range (IQR) | 2.1% | 1.4% |
| Standard Deviation (Sample) | 1.6% | 1.9% |
| Standard Deviation (Population) | 1.6% | 1.9% |
Demographics Similar to Immigrants from Indonesia and Immigrants from Latvia by Doctorate Degree
In terms of doctorate degree, the demographic groups most similar to Immigrants from Indonesia are Bolivian (2.4%, a difference of 0.080%), Immigrants from Czechoslovakia (2.4%, a difference of 0.17%), Immigrants from Ethiopia (2.4%, a difference of 0.61%), Ethiopian (2.3%, a difference of 0.73%), and Bulgarian (2.4%, a difference of 0.80%). Similarly, the demographic groups most similar to Immigrants from Latvia are Bulgarian (2.4%, a difference of 0.12%), Australian (2.4%, a difference of 0.59%), Immigrants from Norway (2.4%, a difference of 0.68%), Bolivian (2.4%, a difference of 0.76%), and Immigrants from Czechoslovakia (2.4%, a difference of 0.85%).
| Demographics | Rating | Rank | Doctorate Degree |
| Soviet Union | 100.0 /100 | #43 | Exceptional 2.5% |
| Immigrants | Netherlands | 100.0 /100 | #44 | Exceptional 2.5% |
| Immigrants | South Africa | 100.0 /100 | #45 | Exceptional 2.4% |
| Immigrants | Austria | 100.0 /100 | #46 | Exceptional 2.4% |
| Immigrants | Western Europe | 100.0 /100 | #47 | Exceptional 2.4% |
| Asians | 100.0 /100 | #48 | Exceptional 2.4% |
| Immigrants | Asia | 100.0 /100 | #49 | Exceptional 2.4% |
| Immigrants | Norway | 100.0 /100 | #50 | Exceptional 2.4% |
| Australians | 100.0 /100 | #51 | Exceptional 2.4% |
| Bulgarians | 100.0 /100 | #52 | Exceptional 2.4% |
| Immigrants | Latvia | 100.0 /100 | #53 | Exceptional 2.4% |
| Immigrants | Indonesia | 100.0 /100 | #54 | Exceptional 2.4% |
| Bolivians | 100.0 /100 | #55 | Exceptional 2.4% |
| Immigrants | Czechoslovakia | 100.0 /100 | #56 | Exceptional 2.4% |
| Immigrants | Ethiopia | 100.0 /100 | #57 | Exceptional 2.4% |
| Ethiopians | 99.9 /100 | #58 | Exceptional 2.3% |
| South Africans | 99.9 /100 | #59 | Exceptional 2.3% |
| Immigrants | Serbia | 99.9 /100 | #60 | Exceptional 2.3% |
| Bhutanese | 99.9 /100 | #61 | Exceptional 2.3% |
| Immigrants | Europe | 99.9 /100 | #62 | Exceptional 2.3% |
| Laotians | 99.9 /100 | #63 | Exceptional 2.3% |