Austrian vs Immigrants from Guatemala Doctorate Degree
COMPARE
Austrian
Immigrants from Guatemala
Doctorate Degree
Doctorate Degree Comparison
Austrians
Immigrants from Guatemala
2.1%
DOCTORATE DEGREE
98.0/ 100
METRIC RATING
104th/ 347
METRIC RANK
1.4%
DOCTORATE DEGREE
0.1/ 100
METRIC RATING
300th/ 347
METRIC RANK
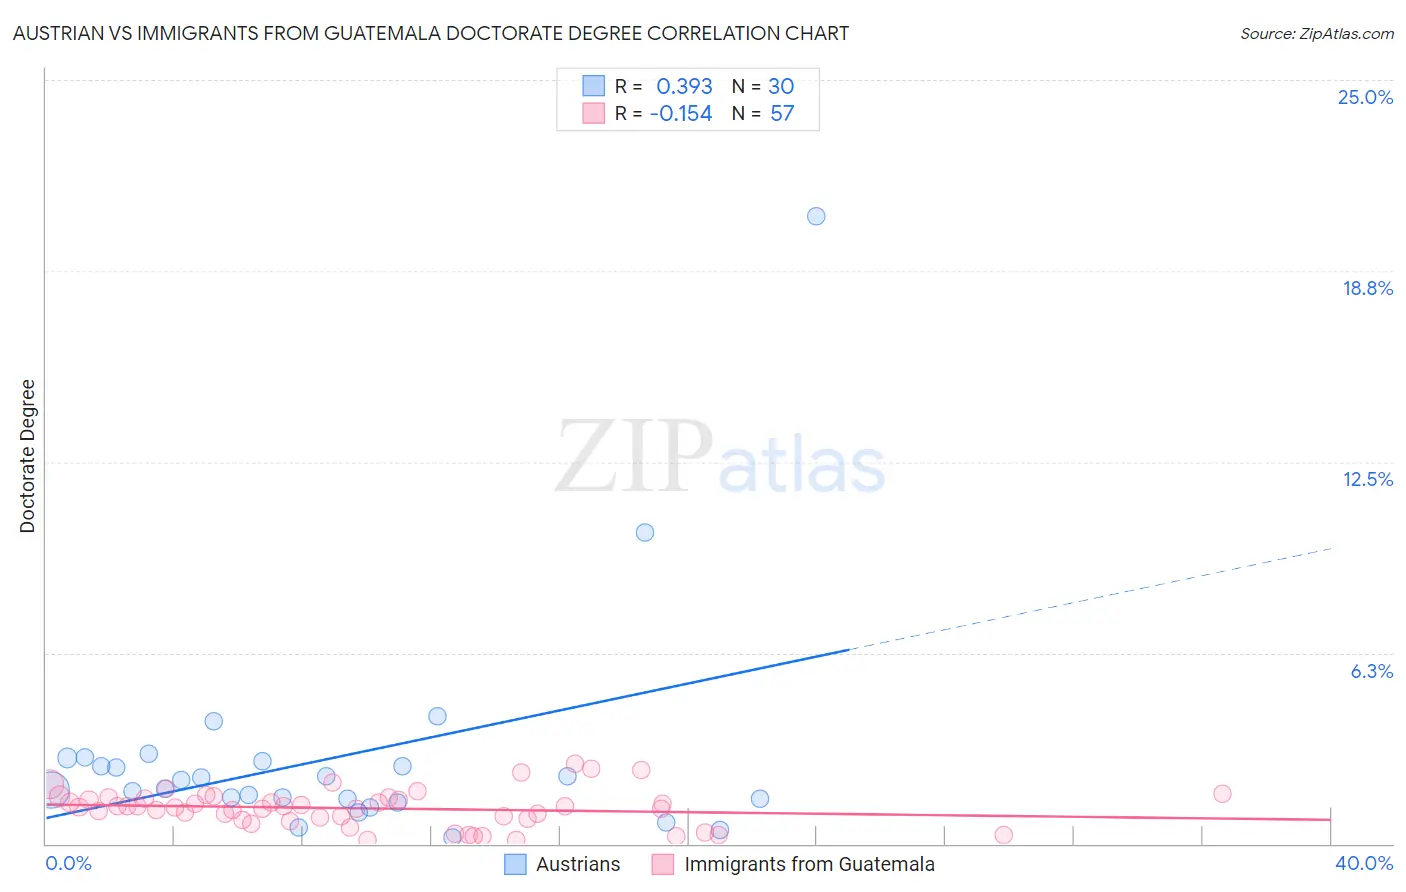
Austrian vs Immigrants from Guatemala Doctorate Degree Correlation Chart
The statistical analysis conducted on geographies consisting of 445,801,331 people shows a mild positive correlation between the proportion of Austrians and percentage of population with at least doctorate degree education in the United States with a correlation coefficient (R) of 0.393 and weighted average of 2.1%. Similarly, the statistical analysis conducted on geographies consisting of 372,323,954 people shows a poor negative correlation between the proportion of Immigrants from Guatemala and percentage of population with at least doctorate degree education in the United States with a correlation coefficient (R) of -0.154 and weighted average of 1.4%, a difference of 51.3%.
Doctorate Degree Correlation Summary
| Measurement | Austrian | Immigrants from Guatemala |
| Minimum | 0.20% | 0.11% |
| Maximum | 20.5% | 2.6% |
| Range | 20.3% | 2.5% |
| Mean | 2.8% | 1.2% |
| Median | 1.9% | 1.2% |
| Interquartile 25% (IQ1) | 1.5% | 0.80% |
| Interquartile 75% (IQ3) | 2.7% | 1.5% |
| Interquartile Range (IQR) | 1.2% | 0.70% |
| Standard Deviation (Sample) | 3.8% | 0.60% |
| Standard Deviation (Population) | 3.7% | 0.59% |
Similar Demographics by Doctorate Degree
Demographics Similar to Austrians by Doctorate Degree
In terms of doctorate degree, the demographic groups most similar to Austrians are Romanian (2.1%, a difference of 0.12%), Immigrants from Chile (2.1%, a difference of 0.13%), Immigrants from Eastern Africa (2.1%, a difference of 0.35%), Arab (2.1%, a difference of 0.35%), and Immigrants from Egypt (2.1%, a difference of 0.38%).
| Demographics | Rating | Rank | Doctorate Degree |
| Immigrants | Eritrea | 98.4 /100 | #97 | Exceptional 2.1% |
| Armenians | 98.3 /100 | #98 | Exceptional 2.1% |
| Immigrants | Egypt | 98.2 /100 | #99 | Exceptional 2.1% |
| Immigrants | Eastern Europe | 98.2 /100 | #100 | Exceptional 2.1% |
| Immigrants | Eastern Africa | 98.2 /100 | #101 | Exceptional 2.1% |
| Immigrants | Chile | 98.1 /100 | #102 | Exceptional 2.1% |
| Romanians | 98.1 /100 | #103 | Exceptional 2.1% |
| Austrians | 98.0 /100 | #104 | Exceptional 2.1% |
| Arabs | 97.8 /100 | #105 | Exceptional 2.1% |
| Sudanese | 97.7 /100 | #106 | Exceptional 2.1% |
| Europeans | 97.5 /100 | #107 | Exceptional 2.1% |
| Immigrants | Germany | 97.3 /100 | #108 | Exceptional 2.1% |
| Ukrainians | 97.2 /100 | #109 | Exceptional 2.1% |
| Brazilians | 97.2 /100 | #110 | Exceptional 2.1% |
| Immigrants | Pakistan | 97.1 /100 | #111 | Exceptional 2.1% |
Demographics Similar to Immigrants from Guatemala by Doctorate Degree
In terms of doctorate degree, the demographic groups most similar to Immigrants from Guatemala are Honduran (1.4%, a difference of 0.070%), Belizean (1.4%, a difference of 0.33%), Shoshone (1.4%, a difference of 0.40%), Immigrants from Dominica (1.4%, a difference of 0.42%), and Mexican American Indian (1.4%, a difference of 0.48%).
| Demographics | Rating | Rank | Doctorate Degree |
| Immigrants | Yemen | 0.2 /100 | #293 | Tragic 1.4% |
| Samoans | 0.2 /100 | #294 | Tragic 1.4% |
| Guatemalans | 0.2 /100 | #295 | Tragic 1.4% |
| Immigrants | Ecuador | 0.2 /100 | #296 | Tragic 1.4% |
| Tsimshian | 0.2 /100 | #297 | Tragic 1.4% |
| Puerto Ricans | 0.1 /100 | #298 | Tragic 1.4% |
| Belizeans | 0.1 /100 | #299 | Tragic 1.4% |
| Immigrants | Guatemala | 0.1 /100 | #300 | Tragic 1.4% |
| Hondurans | 0.1 /100 | #301 | Tragic 1.4% |
| Shoshone | 0.1 /100 | #302 | Tragic 1.4% |
| Immigrants | Dominica | 0.1 /100 | #303 | Tragic 1.4% |
| Mexican American Indians | 0.1 /100 | #304 | Tragic 1.4% |
| Pennsylvania Germans | 0.1 /100 | #305 | Tragic 1.4% |
| Guyanese | 0.1 /100 | #306 | Tragic 1.4% |
| Cubans | 0.1 /100 | #307 | Tragic 1.4% |