Nepalese vs Immigrants from Guatemala College, 1 year or more
COMPARE
Nepalese
Immigrants from Guatemala
College, 1 year or more
College, 1 year or more Comparison
Nepalese
Immigrants from Guatemala
54.9%
COLLEGE, 1 YEAR OR MORE
0.3/ 100
METRIC RATING
259th/ 347
METRIC RANK
50.7%
COLLEGE, 1 YEAR OR MORE
0.0/ 100
METRIC RATING
323rd/ 347
METRIC RANK
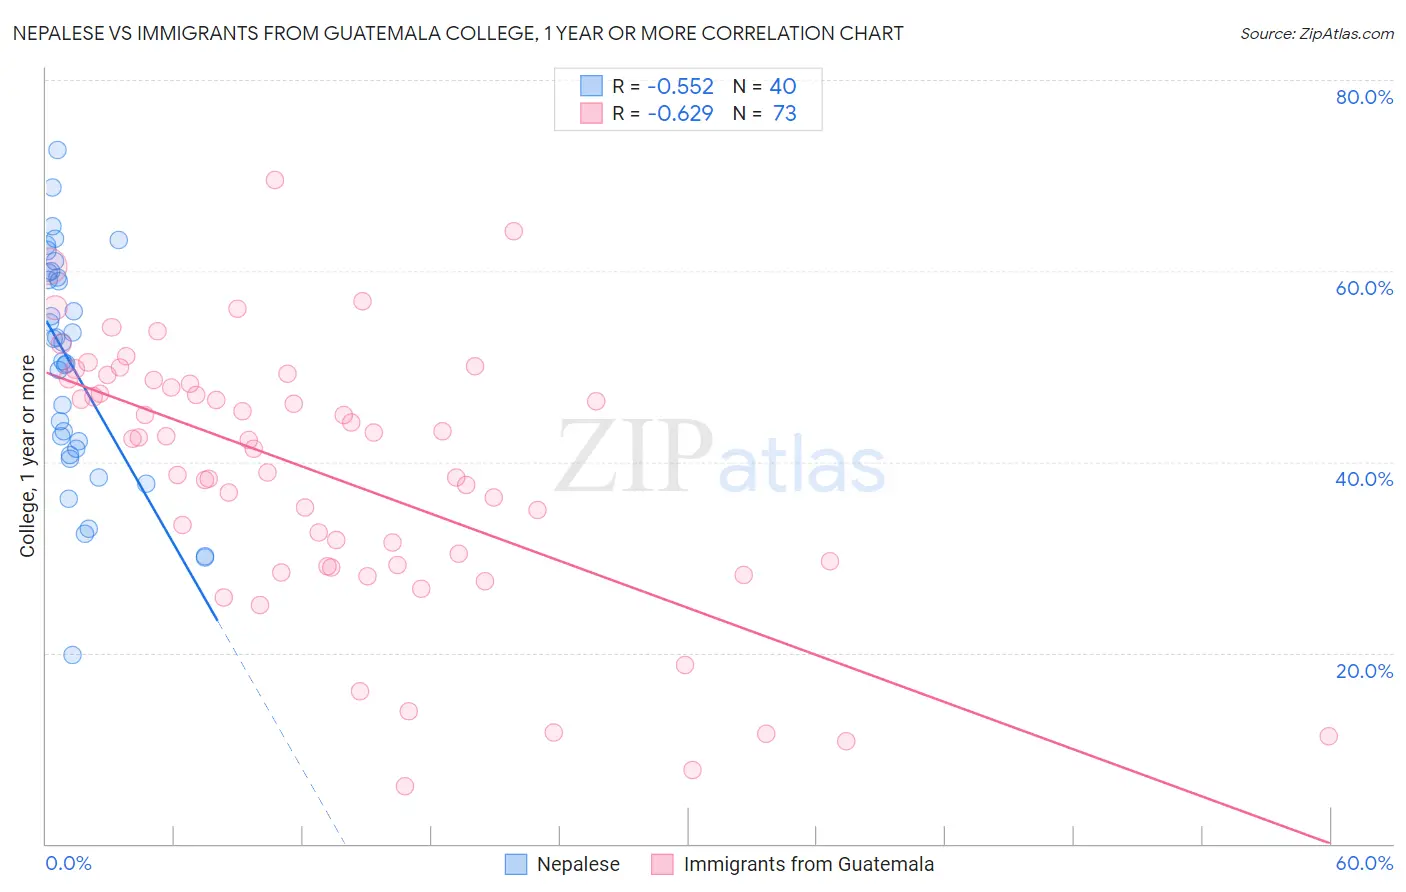
Nepalese vs Immigrants from Guatemala College, 1 year or more Correlation Chart
The statistical analysis conducted on geographies consisting of 24,521,755 people shows a substantial negative correlation between the proportion of Nepalese and percentage of population with at least college, 1 year or more education in the United States with a correlation coefficient (R) of -0.552 and weighted average of 54.9%. Similarly, the statistical analysis conducted on geographies consisting of 377,285,447 people shows a significant negative correlation between the proportion of Immigrants from Guatemala and percentage of population with at least college, 1 year or more education in the United States with a correlation coefficient (R) of -0.629 and weighted average of 50.7%, a difference of 8.3%.
College, 1 year or more Correlation Summary
| Measurement | Nepalese | Immigrants from Guatemala |
| Minimum | 19.8% | 6.0% |
| Maximum | 72.6% | 69.5% |
| Range | 52.8% | 63.5% |
| Mean | 49.8% | 38.6% |
| Median | 51.5% | 42.3% |
| Interquartile 25% (IQ1) | 41.1% | 29.2% |
| Interquartile 75% (IQ3) | 59.5% | 48.4% |
| Interquartile Range (IQR) | 18.5% | 19.2% |
| Standard Deviation (Sample) | 12.1% | 13.8% |
| Standard Deviation (Population) | 11.9% | 13.7% |
Similar Demographics by College, 1 year or more
Demographics Similar to Nepalese by College, 1 year or more
In terms of college, 1 year or more, the demographic groups most similar to Nepalese are African (55.0%, a difference of 0.060%), Jamaican (54.9%, a difference of 0.10%), Ottawa (54.9%, a difference of 0.13%), Immigrants from St. Vincent and the Grenadines (54.8%, a difference of 0.21%), and U.S. Virgin Islander (54.8%, a difference of 0.24%).
| Demographics | Rating | Rank | College, 1 year or more |
| Aleuts | 0.6 /100 | #252 | Tragic 55.4% |
| Immigrants | Barbados | 0.6 /100 | #253 | Tragic 55.4% |
| Japanese | 0.5 /100 | #254 | Tragic 55.2% |
| Immigrants | Bahamas | 0.5 /100 | #255 | Tragic 55.2% |
| Immigrants | West Indies | 0.5 /100 | #256 | Tragic 55.2% |
| Indonesians | 0.4 /100 | #257 | Tragic 55.1% |
| Africans | 0.4 /100 | #258 | Tragic 55.0% |
| Nepalese | 0.3 /100 | #259 | Tragic 54.9% |
| Jamaicans | 0.3 /100 | #260 | Tragic 54.9% |
| Ottawa | 0.3 /100 | #261 | Tragic 54.9% |
| Immigrants | St. Vincent and the Grenadines | 0.3 /100 | #262 | Tragic 54.8% |
| U.S. Virgin Islanders | 0.3 /100 | #263 | Tragic 54.8% |
| Immigrants | Micronesia | 0.3 /100 | #264 | Tragic 54.8% |
| Immigrants | Laos | 0.2 /100 | #265 | Tragic 54.7% |
| Potawatomi | 0.2 /100 | #266 | Tragic 54.6% |
Demographics Similar to Immigrants from Guatemala by College, 1 year or more
In terms of college, 1 year or more, the demographic groups most similar to Immigrants from Guatemala are Immigrants from Cuba (50.7%, a difference of 0.010%), Immigrants from Latin America (50.7%, a difference of 0.040%), Dominican (50.6%, a difference of 0.22%), Navajo (50.8%, a difference of 0.23%), and Menominee (50.6%, a difference of 0.26%).
| Demographics | Rating | Rank | College, 1 year or more |
| Cajuns | 0.0 /100 | #316 | Tragic 51.2% |
| Hispanics or Latinos | 0.0 /100 | #317 | Tragic 51.1% |
| Immigrants | Honduras | 0.0 /100 | #318 | Tragic 51.0% |
| Immigrants | El Salvador | 0.0 /100 | #319 | Tragic 51.0% |
| Kiowa | 0.0 /100 | #320 | Tragic 51.0% |
| Hopi | 0.0 /100 | #321 | Tragic 50.9% |
| Navajo | 0.0 /100 | #322 | Tragic 50.8% |
| Immigrants | Guatemala | 0.0 /100 | #323 | Tragic 50.7% |
| Immigrants | Cuba | 0.0 /100 | #324 | Tragic 50.7% |
| Immigrants | Latin America | 0.0 /100 | #325 | Tragic 50.7% |
| Dominicans | 0.0 /100 | #326 | Tragic 50.6% |
| Menominee | 0.0 /100 | #327 | Tragic 50.6% |
| Dutch West Indians | 0.0 /100 | #328 | Tragic 50.5% |
| Cape Verdeans | 0.0 /100 | #329 | Tragic 50.3% |
| Natives/Alaskans | 0.0 /100 | #330 | Tragic 50.2% |