Immigrants from Brazil vs Immigrants from Guatemala Doctorate Degree
COMPARE
Immigrants from Brazil
Immigrants from Guatemala
Doctorate Degree
Doctorate Degree Comparison
Immigrants from Brazil
Immigrants from Guatemala
2.2%
DOCTORATE DEGREE
99.6/ 100
METRIC RATING
85th/ 347
METRIC RANK
1.4%
DOCTORATE DEGREE
0.1/ 100
METRIC RATING
300th/ 347
METRIC RANK
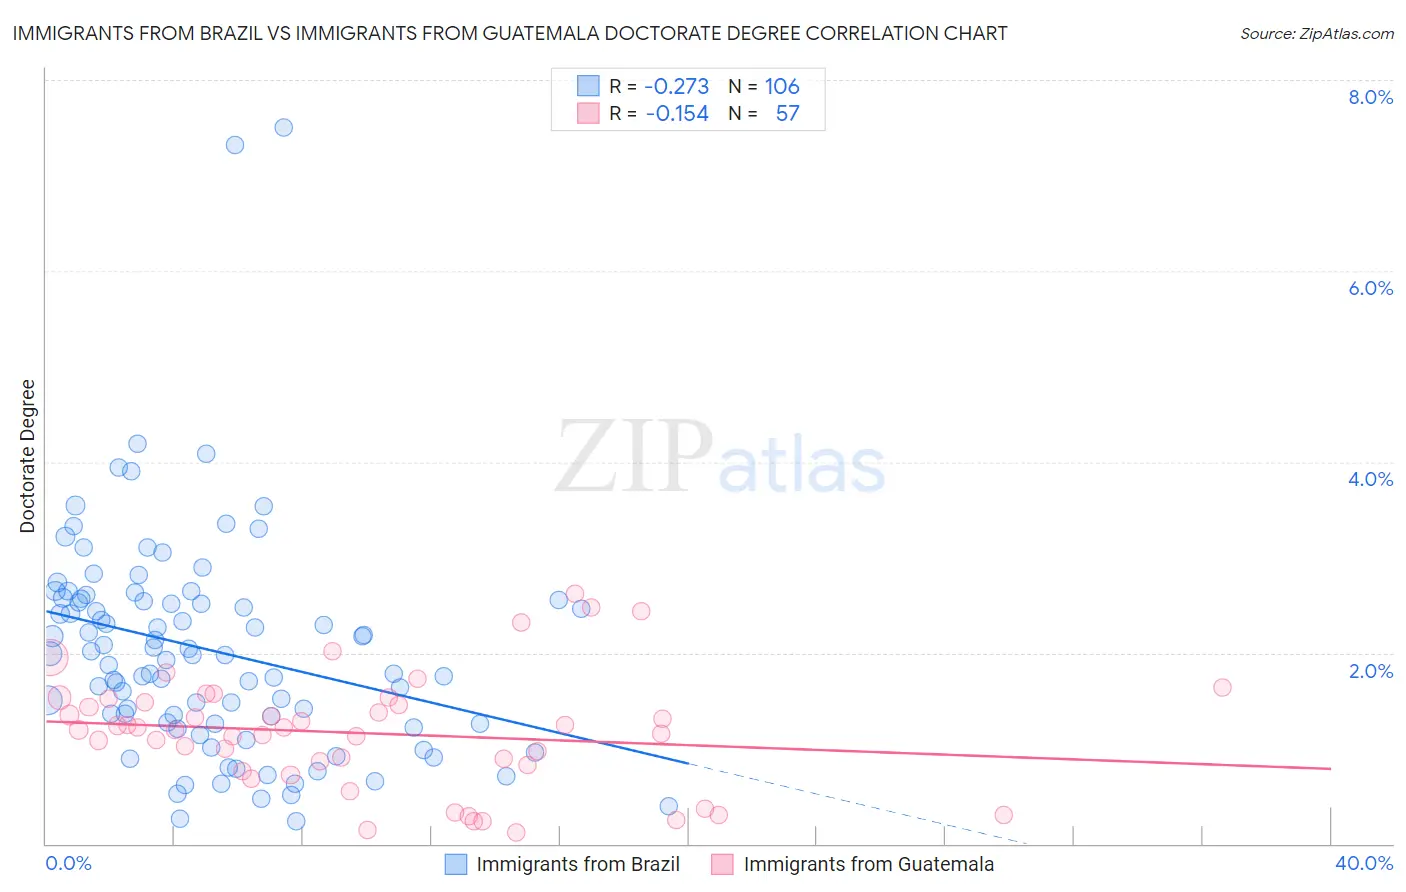
Immigrants from Brazil vs Immigrants from Guatemala Doctorate Degree Correlation Chart
The statistical analysis conducted on geographies consisting of 341,357,062 people shows a weak negative correlation between the proportion of Immigrants from Brazil and percentage of population with at least doctorate degree education in the United States with a correlation coefficient (R) of -0.273 and weighted average of 2.2%. Similarly, the statistical analysis conducted on geographies consisting of 372,323,954 people shows a poor negative correlation between the proportion of Immigrants from Guatemala and percentage of population with at least doctorate degree education in the United States with a correlation coefficient (R) of -0.154 and weighted average of 1.4%, a difference of 58.6%.
Doctorate Degree Correlation Summary
| Measurement | Immigrants from Brazil | Immigrants from Guatemala |
| Minimum | 0.24% | 0.11% |
| Maximum | 7.5% | 2.6% |
| Range | 7.3% | 2.5% |
| Mean | 2.0% | 1.2% |
| Median | 2.0% | 1.2% |
| Interquartile 25% (IQ1) | 1.3% | 0.80% |
| Interquartile 75% (IQ3) | 2.6% | 1.5% |
| Interquartile Range (IQR) | 1.3% | 0.70% |
| Standard Deviation (Sample) | 1.2% | 0.60% |
| Standard Deviation (Population) | 1.2% | 0.59% |
Similar Demographics by Doctorate Degree
Demographics Similar to Immigrants from Brazil by Doctorate Degree
In terms of doctorate degree, the demographic groups most similar to Immigrants from Brazil are Immigrants from England (2.2%, a difference of 0.13%), Immigrants from Lithuania (2.2%, a difference of 0.27%), Immigrants from Uganda (2.2%, a difference of 0.45%), Egyptian (2.2%, a difference of 0.70%), and Immigrants from Zimbabwe (2.2%, a difference of 0.81%).
| Demographics | Rating | Rank | Doctorate Degree |
| Immigrants | Belarus | 99.7 /100 | #78 | Exceptional 2.2% |
| Northern Europeans | 99.7 /100 | #79 | Exceptional 2.2% |
| Ugandans | 99.7 /100 | #80 | Exceptional 2.2% |
| Immigrants | Argentina | 99.7 /100 | #81 | Exceptional 2.2% |
| Immigrants | Uganda | 99.6 /100 | #82 | Exceptional 2.2% |
| Immigrants | Lithuania | 99.6 /100 | #83 | Exceptional 2.2% |
| Immigrants | England | 99.6 /100 | #84 | Exceptional 2.2% |
| Immigrants | Brazil | 99.6 /100 | #85 | Exceptional 2.2% |
| Egyptians | 99.4 /100 | #86 | Exceptional 2.2% |
| Immigrants | Zimbabwe | 99.4 /100 | #87 | Exceptional 2.2% |
| Immigrants | Nepal | 99.3 /100 | #88 | Exceptional 2.2% |
| British | 99.3 /100 | #89 | Exceptional 2.2% |
| Immigrants | Scotland | 99.2 /100 | #90 | Exceptional 2.2% |
| Immigrants | Sudan | 99.1 /100 | #91 | Exceptional 2.2% |
| Chileans | 99.1 /100 | #92 | Exceptional 2.2% |
Demographics Similar to Immigrants from Guatemala by Doctorate Degree
In terms of doctorate degree, the demographic groups most similar to Immigrants from Guatemala are Honduran (1.4%, a difference of 0.070%), Belizean (1.4%, a difference of 0.33%), Shoshone (1.4%, a difference of 0.40%), Immigrants from Dominica (1.4%, a difference of 0.42%), and Mexican American Indian (1.4%, a difference of 0.48%).
| Demographics | Rating | Rank | Doctorate Degree |
| Immigrants | Yemen | 0.2 /100 | #293 | Tragic 1.4% |
| Samoans | 0.2 /100 | #294 | Tragic 1.4% |
| Guatemalans | 0.2 /100 | #295 | Tragic 1.4% |
| Immigrants | Ecuador | 0.2 /100 | #296 | Tragic 1.4% |
| Tsimshian | 0.2 /100 | #297 | Tragic 1.4% |
| Puerto Ricans | 0.1 /100 | #298 | Tragic 1.4% |
| Belizeans | 0.1 /100 | #299 | Tragic 1.4% |
| Immigrants | Guatemala | 0.1 /100 | #300 | Tragic 1.4% |
| Hondurans | 0.1 /100 | #301 | Tragic 1.4% |
| Shoshone | 0.1 /100 | #302 | Tragic 1.4% |
| Immigrants | Dominica | 0.1 /100 | #303 | Tragic 1.4% |
| Mexican American Indians | 0.1 /100 | #304 | Tragic 1.4% |
| Pennsylvania Germans | 0.1 /100 | #305 | Tragic 1.4% |
| Guyanese | 0.1 /100 | #306 | Tragic 1.4% |
| Cubans | 0.1 /100 | #307 | Tragic 1.4% |