Navajo vs Spaniard College, Under 1 year
COMPARE
Navajo
Spaniard
College, Under 1 year
College, Under 1 year Comparison
Navajo
Spaniards
56.3%
COLLEGE, UNDER 1 YEAR
0.0/ 100
METRIC RATING
326th/ 347
METRIC RANK
65.3%
COLLEGE, UNDER 1 YEAR
45.5/ 100
METRIC RATING
181st/ 347
METRIC RANK
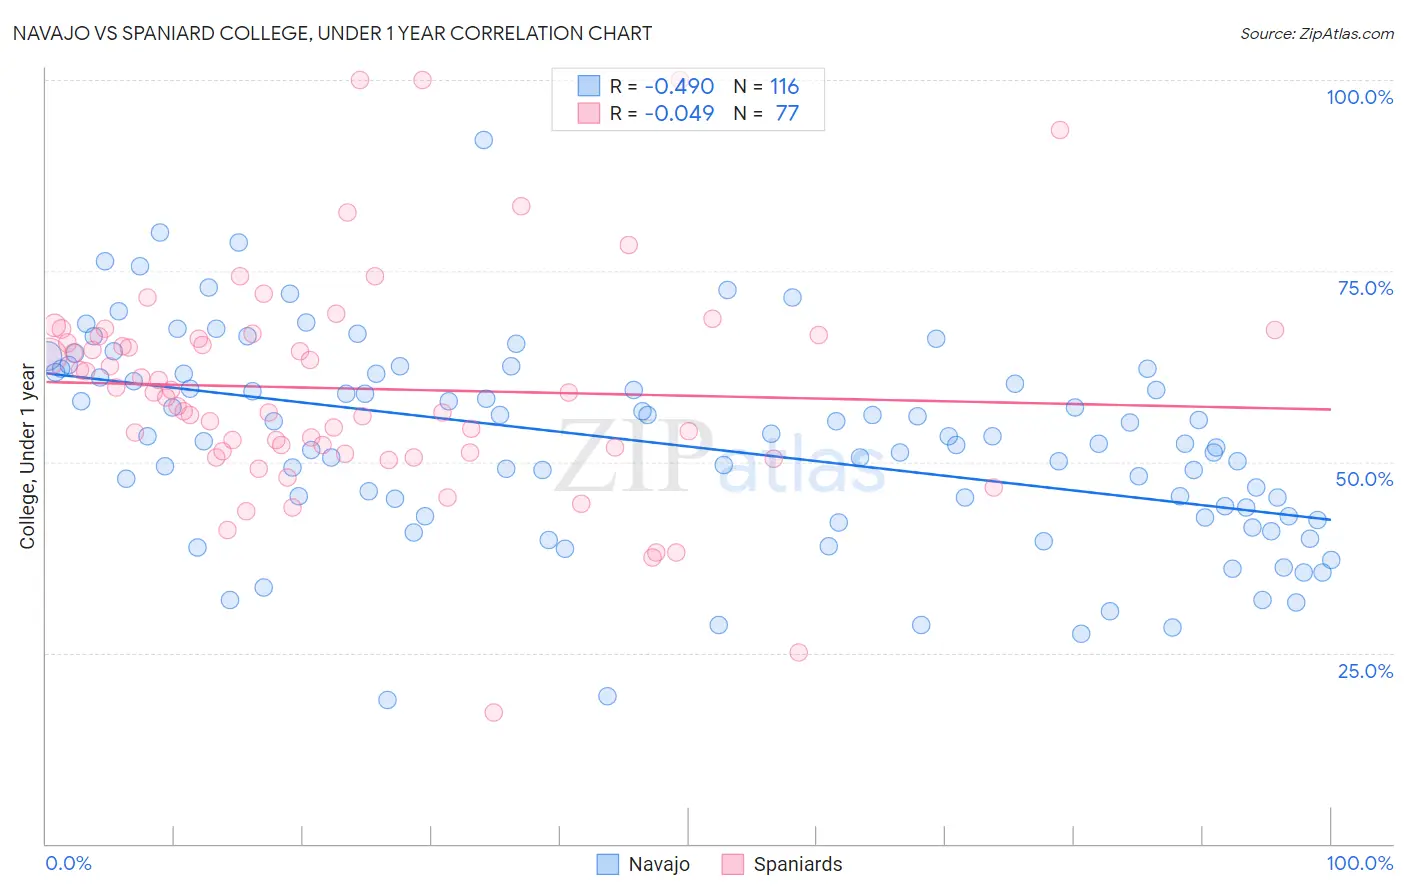
Navajo vs Spaniard College, Under 1 year Correlation Chart
The statistical analysis conducted on geographies consisting of 224,872,431 people shows a moderate negative correlation between the proportion of Navajo and percentage of population with at least college, under 1 year education in the United States with a correlation coefficient (R) of -0.490 and weighted average of 56.3%. Similarly, the statistical analysis conducted on geographies consisting of 443,543,124 people shows no correlation between the proportion of Spaniards and percentage of population with at least college, under 1 year education in the United States with a correlation coefficient (R) of -0.049 and weighted average of 65.3%, a difference of 16.1%.
College, Under 1 year Correlation Summary
| Measurement | Navajo | Spaniard |
| Minimum | 18.9% | 17.2% |
| Maximum | 92.2% | 100.0% |
| Range | 73.3% | 82.8% |
| Mean | 52.4% | 59.6% |
| Median | 52.5% | 59.1% |
| Interquartile 25% (IQ1) | 42.9% | 51.3% |
| Interquartile 75% (IQ3) | 61.6% | 66.5% |
| Interquartile Range (IQR) | 18.7% | 15.2% |
| Standard Deviation (Sample) | 13.3% | 14.6% |
| Standard Deviation (Population) | 13.2% | 14.5% |
Similar Demographics by College, Under 1 year
Demographics Similar to Navajo by College, Under 1 year
In terms of college, under 1 year, the demographic groups most similar to Navajo are Immigrants from Guatemala (56.2%, a difference of 0.090%), Immigrants from Latin America (56.3%, a difference of 0.15%), Immigrants from El Salvador (56.4%, a difference of 0.25%), Immigrants from Honduras (56.5%, a difference of 0.38%), and Cape Verdean (56.0%, a difference of 0.38%).
| Demographics | Rating | Rank | College, Under 1 year |
| Puerto Ricans | 0.0 /100 | #319 | Tragic 56.8% |
| Guatemalans | 0.0 /100 | #320 | Tragic 56.8% |
| Natives/Alaskans | 0.0 /100 | #321 | Tragic 56.6% |
| Immigrants | Caribbean | 0.0 /100 | #322 | Tragic 56.6% |
| Immigrants | Honduras | 0.0 /100 | #323 | Tragic 56.5% |
| Immigrants | El Salvador | 0.0 /100 | #324 | Tragic 56.4% |
| Immigrants | Latin America | 0.0 /100 | #325 | Tragic 56.3% |
| Navajo | 0.0 /100 | #326 | Tragic 56.3% |
| Immigrants | Guatemala | 0.0 /100 | #327 | Tragic 56.2% |
| Cape Verdeans | 0.0 /100 | #328 | Tragic 56.0% |
| Immigrants | Cuba | 0.0 /100 | #329 | Tragic 55.7% |
| Mexicans | 0.0 /100 | #330 | Tragic 55.6% |
| Dominicans | 0.0 /100 | #331 | Tragic 55.5% |
| Immigrants | Yemen | 0.0 /100 | #332 | Tragic 55.3% |
| Yuman | 0.0 /100 | #333 | Tragic 55.1% |
Demographics Similar to Spaniards by College, Under 1 year
In terms of college, under 1 year, the demographic groups most similar to Spaniards are Dutch (65.3%, a difference of 0.030%), Immigrants from Africa (65.3%, a difference of 0.040%), German Russian (65.4%, a difference of 0.12%), Guamanian/Chamorro (65.4%, a difference of 0.12%), and Immigrants from Poland (65.2%, a difference of 0.13%).
| Demographics | Rating | Rank | College, Under 1 year |
| Immigrants | Bosnia and Herzegovina | 50.0 /100 | #174 | Average 65.4% |
| Scotch-Irish | 49.5 /100 | #175 | Average 65.4% |
| French | 48.9 /100 | #176 | Average 65.4% |
| Immigrants | North Macedonia | 48.6 /100 | #177 | Average 65.4% |
| German Russians | 48.3 /100 | #178 | Average 65.4% |
| Guamanians/Chamorros | 48.2 /100 | #179 | Average 65.4% |
| Dutch | 46.1 /100 | #180 | Average 65.3% |
| Spaniards | 45.5 /100 | #181 | Average 65.3% |
| Immigrants | Africa | 44.7 /100 | #182 | Average 65.3% |
| Immigrants | Poland | 42.6 /100 | #183 | Average 65.2% |
| Bermudans | 42.0 /100 | #184 | Average 65.2% |
| Sri Lankans | 41.7 /100 | #185 | Average 65.2% |
| Immigrants | Sierra Leone | 39.7 /100 | #186 | Fair 65.1% |
| Immigrants | Southern Europe | 34.3 /100 | #187 | Fair 64.9% |
| Immigrants | Albania | 32.0 /100 | #188 | Fair 64.9% |