Immigrants from Sri Lanka vs Spaniard College, Under 1 year
COMPARE
Immigrants from Sri Lanka
Spaniard
College, Under 1 year
College, Under 1 year Comparison
Immigrants from Sri Lanka
Spaniards
70.5%
COLLEGE, UNDER 1 YEAR
99.9/ 100
METRIC RATING
36th/ 347
METRIC RANK
65.3%
COLLEGE, UNDER 1 YEAR
45.5/ 100
METRIC RATING
181st/ 347
METRIC RANK
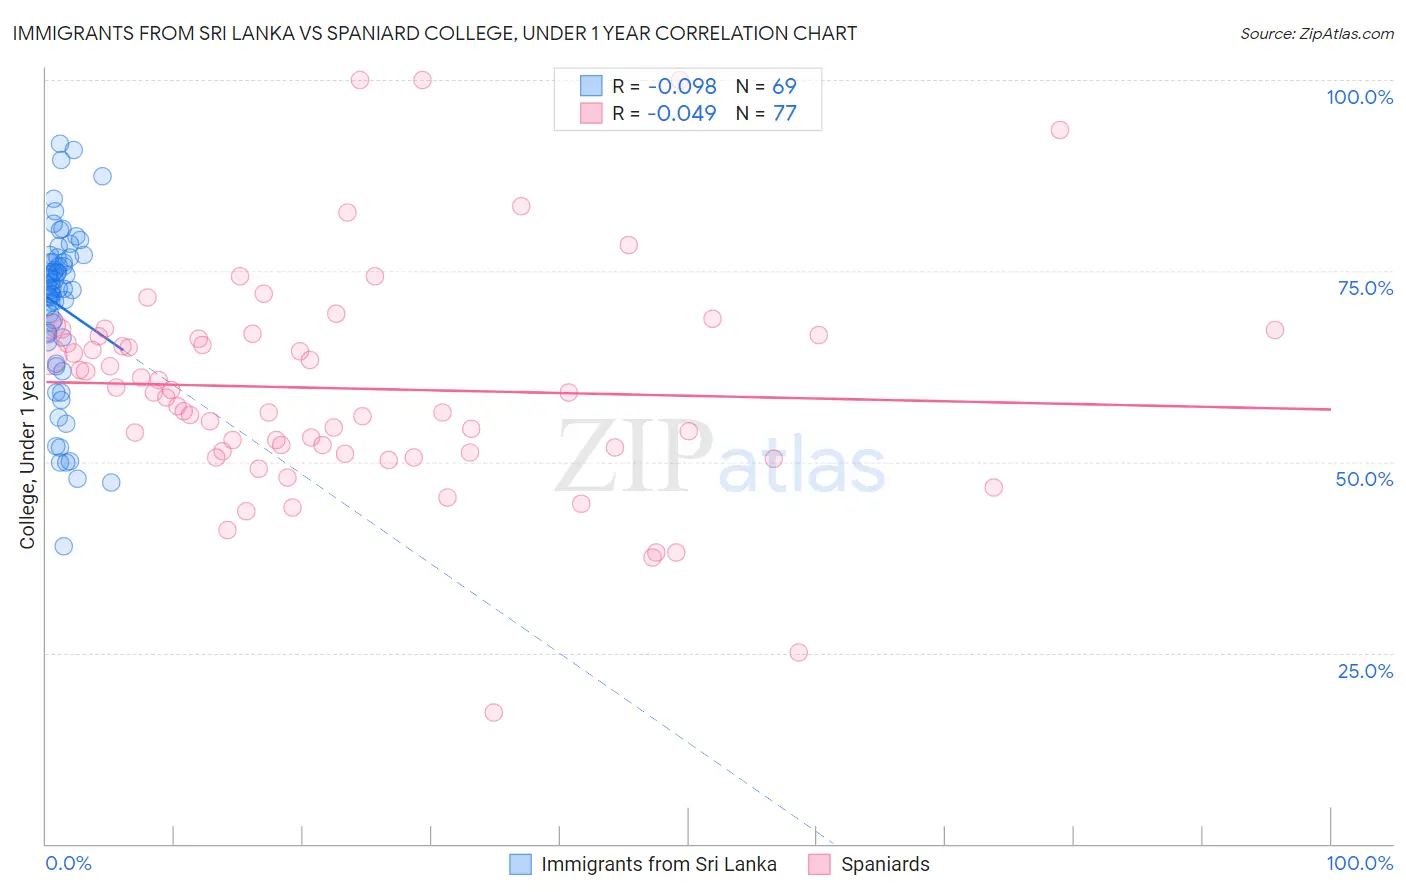
Immigrants from Sri Lanka vs Spaniard College, Under 1 year Correlation Chart
The statistical analysis conducted on geographies consisting of 149,700,552 people shows a slight negative correlation between the proportion of Immigrants from Sri Lanka and percentage of population with at least college, under 1 year education in the United States with a correlation coefficient (R) of -0.098 and weighted average of 70.5%. Similarly, the statistical analysis conducted on geographies consisting of 443,543,124 people shows no correlation between the proportion of Spaniards and percentage of population with at least college, under 1 year education in the United States with a correlation coefficient (R) of -0.049 and weighted average of 65.3%, a difference of 8.0%.
College, Under 1 year Correlation Summary
| Measurement | Immigrants from Sri Lanka | Spaniard |
| Minimum | 38.9% | 17.2% |
| Maximum | 91.7% | 100.0% |
| Range | 52.8% | 82.8% |
| Mean | 70.4% | 59.6% |
| Median | 72.6% | 59.1% |
| Interquartile 25% (IQ1) | 66.0% | 51.3% |
| Interquartile 75% (IQ3) | 76.4% | 66.5% |
| Interquartile Range (IQR) | 10.4% | 15.2% |
| Standard Deviation (Sample) | 10.9% | 14.6% |
| Standard Deviation (Population) | 10.8% | 14.5% |
Similar Demographics by College, Under 1 year
Demographics Similar to Immigrants from Sri Lanka by College, Under 1 year
In terms of college, under 1 year, the demographic groups most similar to Immigrants from Sri Lanka are Russian (70.5%, a difference of 0.060%), Immigrants from Saudi Arabia (70.4%, a difference of 0.11%), Estonian (70.6%, a difference of 0.15%), Immigrants from South Africa (70.6%, a difference of 0.16%), and Australian (70.4%, a difference of 0.18%).
| Demographics | Rating | Rank | College, Under 1 year |
| Immigrants | France | 100.0 /100 | #29 | Exceptional 71.0% |
| Immigrants | China | 99.9 /100 | #30 | Exceptional 70.9% |
| Indians (Asian) | 99.9 /100 | #31 | Exceptional 70.8% |
| Turks | 99.9 /100 | #32 | Exceptional 70.7% |
| Immigrants | South Africa | 99.9 /100 | #33 | Exceptional 70.6% |
| Estonians | 99.9 /100 | #34 | Exceptional 70.6% |
| Russians | 99.9 /100 | #35 | Exceptional 70.5% |
| Immigrants | Sri Lanka | 99.9 /100 | #36 | Exceptional 70.5% |
| Immigrants | Saudi Arabia | 99.9 /100 | #37 | Exceptional 70.4% |
| Australians | 99.9 /100 | #38 | Exceptional 70.4% |
| Bhutanese | 99.9 /100 | #39 | Exceptional 70.3% |
| Immigrants | Turkey | 99.9 /100 | #40 | Exceptional 70.3% |
| Immigrants | Kuwait | 99.9 /100 | #41 | Exceptional 70.3% |
| Immigrants | Lithuania | 99.9 /100 | #42 | Exceptional 70.3% |
| Israelis | 99.9 /100 | #43 | Exceptional 70.2% |
Demographics Similar to Spaniards by College, Under 1 year
In terms of college, under 1 year, the demographic groups most similar to Spaniards are Dutch (65.3%, a difference of 0.030%), Immigrants from Africa (65.3%, a difference of 0.040%), German Russian (65.4%, a difference of 0.12%), Guamanian/Chamorro (65.4%, a difference of 0.12%), and Immigrants from Poland (65.2%, a difference of 0.13%).
| Demographics | Rating | Rank | College, Under 1 year |
| Immigrants | Bosnia and Herzegovina | 50.0 /100 | #174 | Average 65.4% |
| Scotch-Irish | 49.5 /100 | #175 | Average 65.4% |
| French | 48.9 /100 | #176 | Average 65.4% |
| Immigrants | North Macedonia | 48.6 /100 | #177 | Average 65.4% |
| German Russians | 48.3 /100 | #178 | Average 65.4% |
| Guamanians/Chamorros | 48.2 /100 | #179 | Average 65.4% |
| Dutch | 46.1 /100 | #180 | Average 65.3% |
| Spaniards | 45.5 /100 | #181 | Average 65.3% |
| Immigrants | Africa | 44.7 /100 | #182 | Average 65.3% |
| Immigrants | Poland | 42.6 /100 | #183 | Average 65.2% |
| Bermudans | 42.0 /100 | #184 | Average 65.2% |
| Sri Lankans | 41.7 /100 | #185 | Average 65.2% |
| Immigrants | Sierra Leone | 39.7 /100 | #186 | Fair 65.1% |
| Immigrants | Southern Europe | 34.3 /100 | #187 | Fair 64.9% |
| Immigrants | Albania | 32.0 /100 | #188 | Fair 64.9% |