Bangladeshi vs Spaniard College, Under 1 year
COMPARE
Bangladeshi
Spaniard
College, Under 1 year
College, Under 1 year Comparison
Bangladeshis
Spaniards
61.4%
COLLEGE, UNDER 1 YEAR
0.4/ 100
METRIC RATING
256th/ 347
METRIC RANK
65.3%
COLLEGE, UNDER 1 YEAR
45.5/ 100
METRIC RATING
181st/ 347
METRIC RANK
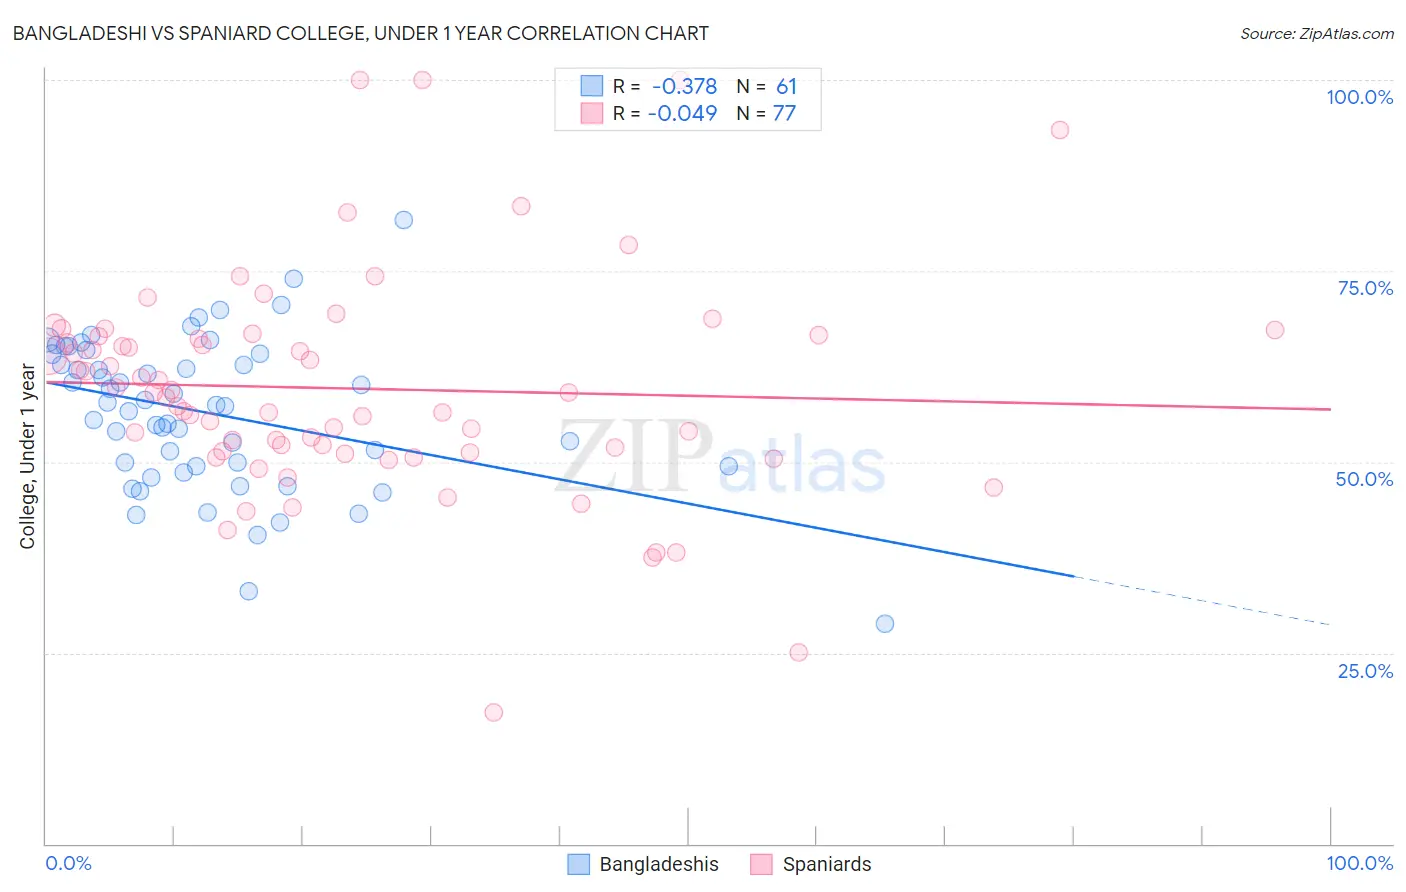
Bangladeshi vs Spaniard College, Under 1 year Correlation Chart
The statistical analysis conducted on geographies consisting of 141,449,898 people shows a mild negative correlation between the proportion of Bangladeshis and percentage of population with at least college, under 1 year education in the United States with a correlation coefficient (R) of -0.378 and weighted average of 61.4%. Similarly, the statistical analysis conducted on geographies consisting of 443,543,124 people shows no correlation between the proportion of Spaniards and percentage of population with at least college, under 1 year education in the United States with a correlation coefficient (R) of -0.049 and weighted average of 65.3%, a difference of 6.4%.
College, Under 1 year Correlation Summary
| Measurement | Bangladeshi | Spaniard |
| Minimum | 28.8% | 17.2% |
| Maximum | 81.6% | 100.0% |
| Range | 52.9% | 82.8% |
| Mean | 56.4% | 59.6% |
| Median | 57.4% | 59.1% |
| Interquartile 25% (IQ1) | 49.5% | 51.3% |
| Interquartile 75% (IQ3) | 64.1% | 66.5% |
| Interquartile Range (IQR) | 14.7% | 15.2% |
| Standard Deviation (Sample) | 9.9% | 14.6% |
| Standard Deviation (Population) | 9.8% | 14.5% |
Similar Demographics by College, Under 1 year
Demographics Similar to Bangladeshis by College, Under 1 year
In terms of college, under 1 year, the demographic groups most similar to Bangladeshis are Comanche (61.4%, a difference of 0.040%), Immigrants from Laos (61.3%, a difference of 0.11%), West Indian (61.5%, a difference of 0.17%), Japanese (61.5%, a difference of 0.17%), and Immigrants from Cambodia (61.5%, a difference of 0.17%).
| Demographics | Rating | Rank | College, Under 1 year |
| Vietnamese | 0.5 /100 | #249 | Tragic 61.7% |
| Immigrants | Congo | 0.5 /100 | #250 | Tragic 61.7% |
| Immigrants | Micronesia | 0.5 /100 | #251 | Tragic 61.5% |
| West Indians | 0.4 /100 | #252 | Tragic 61.5% |
| Japanese | 0.4 /100 | #253 | Tragic 61.5% |
| Immigrants | Cambodia | 0.4 /100 | #254 | Tragic 61.5% |
| Comanche | 0.4 /100 | #255 | Tragic 61.4% |
| Bangladeshis | 0.4 /100 | #256 | Tragic 61.4% |
| Immigrants | Laos | 0.3 /100 | #257 | Tragic 61.3% |
| Immigrants | Bangladesh | 0.3 /100 | #258 | Tragic 61.3% |
| Indonesians | 0.3 /100 | #259 | Tragic 61.2% |
| Blackfeet | 0.3 /100 | #260 | Tragic 61.1% |
| Africans | 0.3 /100 | #261 | Tragic 61.1% |
| Barbadians | 0.2 /100 | #262 | Tragic 61.1% |
| Shoshone | 0.2 /100 | #263 | Tragic 61.1% |
Demographics Similar to Spaniards by College, Under 1 year
In terms of college, under 1 year, the demographic groups most similar to Spaniards are Dutch (65.3%, a difference of 0.030%), Immigrants from Africa (65.3%, a difference of 0.040%), German Russian (65.4%, a difference of 0.12%), Guamanian/Chamorro (65.4%, a difference of 0.12%), and Immigrants from Poland (65.2%, a difference of 0.13%).
| Demographics | Rating | Rank | College, Under 1 year |
| Immigrants | Bosnia and Herzegovina | 50.0 /100 | #174 | Average 65.4% |
| Scotch-Irish | 49.5 /100 | #175 | Average 65.4% |
| French | 48.9 /100 | #176 | Average 65.4% |
| Immigrants | North Macedonia | 48.6 /100 | #177 | Average 65.4% |
| German Russians | 48.3 /100 | #178 | Average 65.4% |
| Guamanians/Chamorros | 48.2 /100 | #179 | Average 65.4% |
| Dutch | 46.1 /100 | #180 | Average 65.3% |
| Spaniards | 45.5 /100 | #181 | Average 65.3% |
| Immigrants | Africa | 44.7 /100 | #182 | Average 65.3% |
| Immigrants | Poland | 42.6 /100 | #183 | Average 65.2% |
| Bermudans | 42.0 /100 | #184 | Average 65.2% |
| Sri Lankans | 41.7 /100 | #185 | Average 65.2% |
| Immigrants | Sierra Leone | 39.7 /100 | #186 | Fair 65.1% |
| Immigrants | Southern Europe | 34.3 /100 | #187 | Fair 64.9% |
| Immigrants | Albania | 32.0 /100 | #188 | Fair 64.9% |