Immigrants from Switzerland vs Spaniard College, Under 1 year
COMPARE
Immigrants from Switzerland
Spaniard
College, Under 1 year
College, Under 1 year Comparison
Immigrants from Switzerland
Spaniards
71.7%
COLLEGE, UNDER 1 YEAR
100.0/ 100
METRIC RATING
18th/ 347
METRIC RANK
65.3%
COLLEGE, UNDER 1 YEAR
45.5/ 100
METRIC RATING
181st/ 347
METRIC RANK
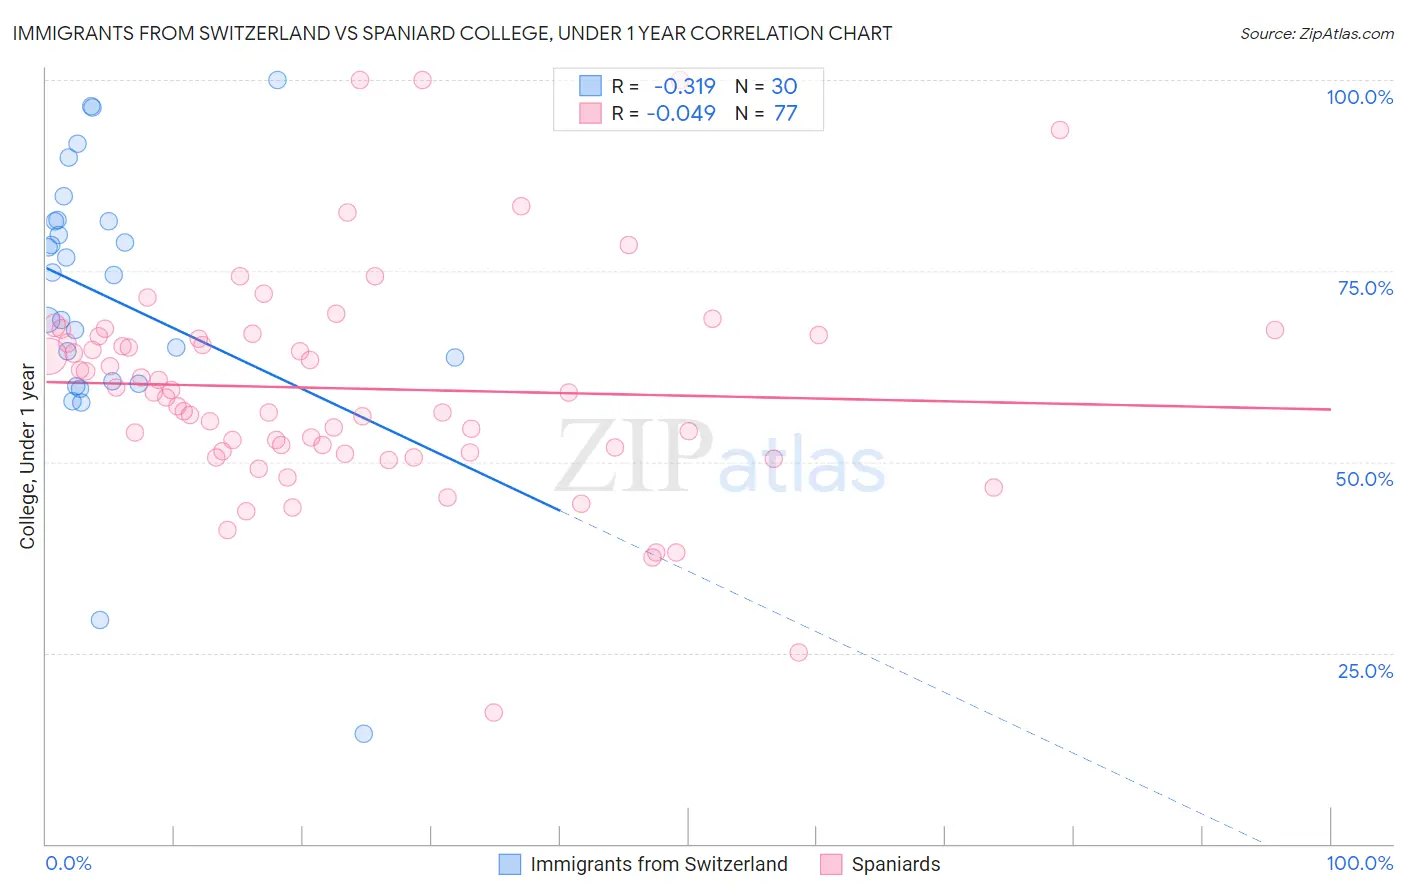
Immigrants from Switzerland vs Spaniard College, Under 1 year Correlation Chart
The statistical analysis conducted on geographies consisting of 148,083,583 people shows a mild negative correlation between the proportion of Immigrants from Switzerland and percentage of population with at least college, under 1 year education in the United States with a correlation coefficient (R) of -0.319 and weighted average of 71.7%. Similarly, the statistical analysis conducted on geographies consisting of 443,543,124 people shows no correlation between the proportion of Spaniards and percentage of population with at least college, under 1 year education in the United States with a correlation coefficient (R) of -0.049 and weighted average of 65.3%, a difference of 9.8%.
College, Under 1 year Correlation Summary
| Measurement | Immigrants from Switzerland | Spaniard |
| Minimum | 14.4% | 17.2% |
| Maximum | 100.0% | 100.0% |
| Range | 85.6% | 82.8% |
| Mean | 71.4% | 59.6% |
| Median | 74.6% | 59.1% |
| Interquartile 25% (IQ1) | 60.6% | 51.3% |
| Interquartile 75% (IQ3) | 81.5% | 66.5% |
| Interquartile Range (IQR) | 20.9% | 15.2% |
| Standard Deviation (Sample) | 18.2% | 14.6% |
| Standard Deviation (Population) | 17.9% | 14.5% |
Similar Demographics by College, Under 1 year
Demographics Similar to Immigrants from Switzerland by College, Under 1 year
In terms of college, under 1 year, the demographic groups most similar to Immigrants from Switzerland are Latvian (71.6%, a difference of 0.11%), Eastern European (71.8%, a difference of 0.13%), Immigrants from Korea (71.6%, a difference of 0.15%), Immigrants from Japan (71.9%, a difference of 0.28%), and Cambodian (71.9%, a difference of 0.29%).
| Demographics | Rating | Rank | College, Under 1 year |
| Immigrants | South Central Asia | 100.0 /100 | #11 | Exceptional 72.1% |
| Immigrants | Sweden | 100.0 /100 | #12 | Exceptional 72.1% |
| Cypriots | 100.0 /100 | #13 | Exceptional 72.0% |
| Cambodians | 100.0 /100 | #14 | Exceptional 71.9% |
| Burmese | 100.0 /100 | #15 | Exceptional 71.9% |
| Immigrants | Japan | 100.0 /100 | #16 | Exceptional 71.9% |
| Eastern Europeans | 100.0 /100 | #17 | Exceptional 71.8% |
| Immigrants | Switzerland | 100.0 /100 | #18 | Exceptional 71.7% |
| Latvians | 100.0 /100 | #19 | Exceptional 71.6% |
| Immigrants | Korea | 100.0 /100 | #20 | Exceptional 71.6% |
| Immigrants | Belgium | 100.0 /100 | #21 | Exceptional 71.5% |
| Immigrants | Eastern Asia | 100.0 /100 | #22 | Exceptional 71.3% |
| Immigrants | Northern Europe | 100.0 /100 | #23 | Exceptional 71.1% |
| Soviet Union | 100.0 /100 | #24 | Exceptional 71.1% |
| Bulgarians | 100.0 /100 | #25 | Exceptional 71.1% |
Demographics Similar to Spaniards by College, Under 1 year
In terms of college, under 1 year, the demographic groups most similar to Spaniards are Dutch (65.3%, a difference of 0.030%), Immigrants from Africa (65.3%, a difference of 0.040%), German Russian (65.4%, a difference of 0.12%), Guamanian/Chamorro (65.4%, a difference of 0.12%), and Immigrants from Poland (65.2%, a difference of 0.13%).
| Demographics | Rating | Rank | College, Under 1 year |
| Immigrants | Bosnia and Herzegovina | 50.0 /100 | #174 | Average 65.4% |
| Scotch-Irish | 49.5 /100 | #175 | Average 65.4% |
| French | 48.9 /100 | #176 | Average 65.4% |
| Immigrants | North Macedonia | 48.6 /100 | #177 | Average 65.4% |
| German Russians | 48.3 /100 | #178 | Average 65.4% |
| Guamanians/Chamorros | 48.2 /100 | #179 | Average 65.4% |
| Dutch | 46.1 /100 | #180 | Average 65.3% |
| Spaniards | 45.5 /100 | #181 | Average 65.3% |
| Immigrants | Africa | 44.7 /100 | #182 | Average 65.3% |
| Immigrants | Poland | 42.6 /100 | #183 | Average 65.2% |
| Bermudans | 42.0 /100 | #184 | Average 65.2% |
| Sri Lankans | 41.7 /100 | #185 | Average 65.2% |
| Immigrants | Sierra Leone | 39.7 /100 | #186 | Fair 65.1% |
| Immigrants | Southern Europe | 34.3 /100 | #187 | Fair 64.9% |
| Immigrants | Albania | 32.0 /100 | #188 | Fair 64.9% |