Kiowa vs Spaniard College, Under 1 year
COMPARE
Kiowa
Spaniard
College, Under 1 year
College, Under 1 year Comparison
Kiowa
Spaniards
57.8%
COLLEGE, UNDER 1 YEAR
0.0/ 100
METRIC RATING
304th/ 347
METRIC RANK
65.3%
COLLEGE, UNDER 1 YEAR
45.5/ 100
METRIC RATING
181st/ 347
METRIC RANK
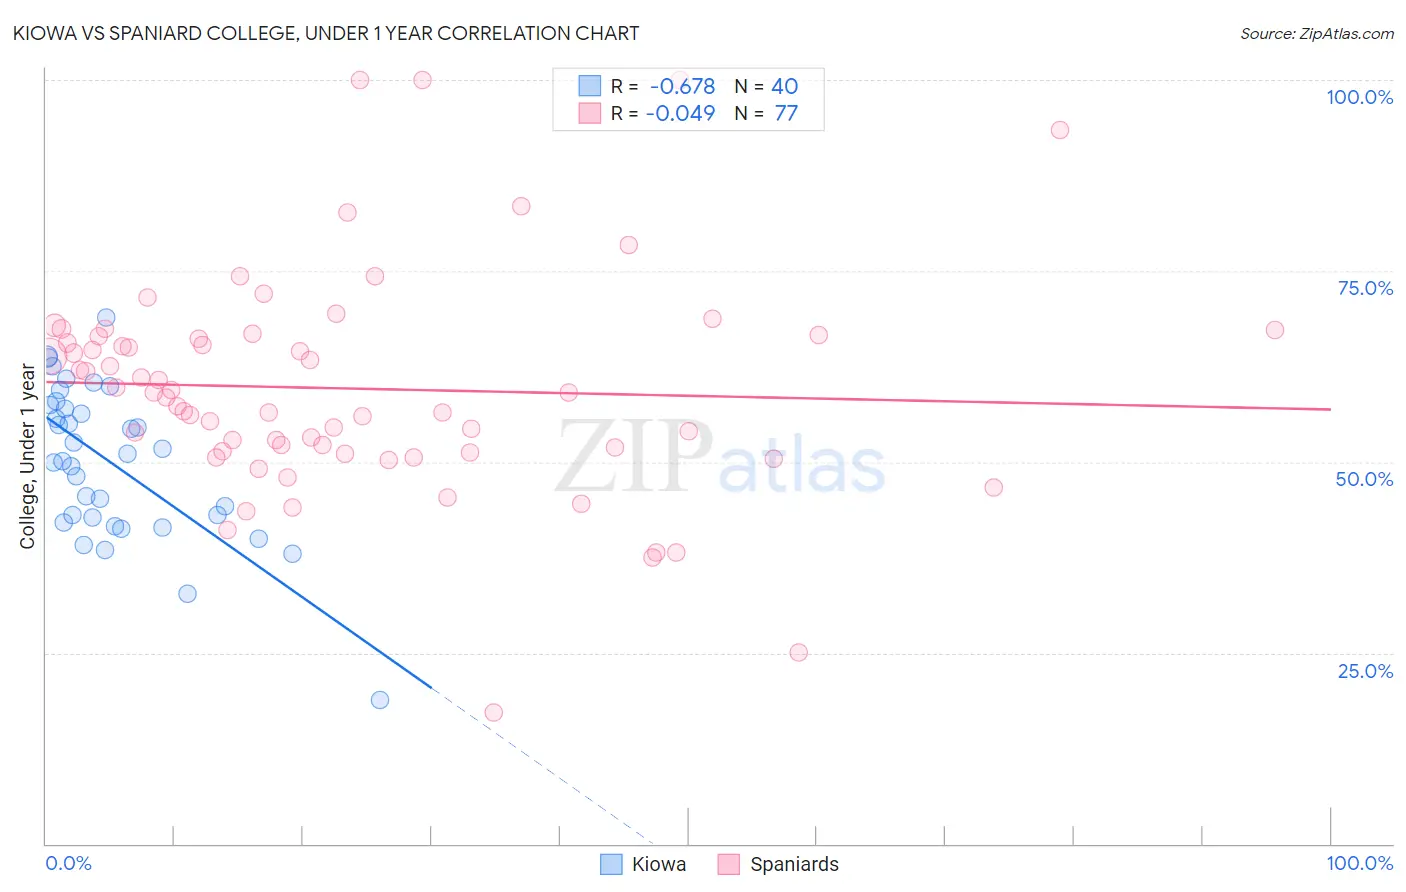
Kiowa vs Spaniard College, Under 1 year Correlation Chart
The statistical analysis conducted on geographies consisting of 56,101,444 people shows a significant negative correlation between the proportion of Kiowa and percentage of population with at least college, under 1 year education in the United States with a correlation coefficient (R) of -0.678 and weighted average of 57.8%. Similarly, the statistical analysis conducted on geographies consisting of 443,543,124 people shows no correlation between the proportion of Spaniards and percentage of population with at least college, under 1 year education in the United States with a correlation coefficient (R) of -0.049 and weighted average of 65.3%, a difference of 12.9%.
College, Under 1 year Correlation Summary
| Measurement | Kiowa | Spaniard |
| Minimum | 18.8% | 17.2% |
| Maximum | 68.9% | 100.0% |
| Range | 50.2% | 82.8% |
| Mean | 49.8% | 59.6% |
| Median | 50.6% | 59.1% |
| Interquartile 25% (IQ1) | 42.4% | 51.3% |
| Interquartile 75% (IQ3) | 57.2% | 66.5% |
| Interquartile Range (IQR) | 14.8% | 15.2% |
| Standard Deviation (Sample) | 10.0% | 14.6% |
| Standard Deviation (Population) | 9.9% | 14.5% |
Similar Demographics by College, Under 1 year
Demographics Similar to Kiowa by College, Under 1 year
In terms of college, under 1 year, the demographic groups most similar to Kiowa are Immigrants from Dominica (57.9%, a difference of 0.010%), Haitian (57.8%, a difference of 0.11%), Apache (58.0%, a difference of 0.30%), Immigrants from Portugal (57.7%, a difference of 0.31%), and Fijian (57.7%, a difference of 0.32%).
| Demographics | Rating | Rank | College, Under 1 year |
| Guyanese | 0.0 /100 | #297 | Tragic 59.0% |
| Immigrants | Ecuador | 0.0 /100 | #298 | Tragic 58.7% |
| Cubans | 0.0 /100 | #299 | Tragic 58.6% |
| Immigrants | Guyana | 0.0 /100 | #300 | Tragic 58.5% |
| Mexican American Indians | 0.0 /100 | #301 | Tragic 58.1% |
| Apache | 0.0 /100 | #302 | Tragic 58.0% |
| Immigrants | Dominica | 0.0 /100 | #303 | Tragic 57.9% |
| Kiowa | 0.0 /100 | #304 | Tragic 57.8% |
| Haitians | 0.0 /100 | #305 | Tragic 57.8% |
| Immigrants | Portugal | 0.0 /100 | #306 | Tragic 57.7% |
| Fijians | 0.0 /100 | #307 | Tragic 57.7% |
| Central Americans | 0.0 /100 | #308 | Tragic 57.7% |
| Immigrants | Nicaragua | 0.0 /100 | #309 | Tragic 57.6% |
| Pueblo | 0.0 /100 | #310 | Tragic 57.4% |
| Cajuns | 0.0 /100 | #311 | Tragic 57.3% |
Demographics Similar to Spaniards by College, Under 1 year
In terms of college, under 1 year, the demographic groups most similar to Spaniards are Dutch (65.3%, a difference of 0.030%), Immigrants from Africa (65.3%, a difference of 0.040%), German Russian (65.4%, a difference of 0.12%), Guamanian/Chamorro (65.4%, a difference of 0.12%), and Immigrants from Poland (65.2%, a difference of 0.13%).
| Demographics | Rating | Rank | College, Under 1 year |
| Immigrants | Bosnia and Herzegovina | 50.0 /100 | #174 | Average 65.4% |
| Scotch-Irish | 49.5 /100 | #175 | Average 65.4% |
| French | 48.9 /100 | #176 | Average 65.4% |
| Immigrants | North Macedonia | 48.6 /100 | #177 | Average 65.4% |
| German Russians | 48.3 /100 | #178 | Average 65.4% |
| Guamanians/Chamorros | 48.2 /100 | #179 | Average 65.4% |
| Dutch | 46.1 /100 | #180 | Average 65.3% |
| Spaniards | 45.5 /100 | #181 | Average 65.3% |
| Immigrants | Africa | 44.7 /100 | #182 | Average 65.3% |
| Immigrants | Poland | 42.6 /100 | #183 | Average 65.2% |
| Bermudans | 42.0 /100 | #184 | Average 65.2% |
| Sri Lankans | 41.7 /100 | #185 | Average 65.2% |
| Immigrants | Sierra Leone | 39.7 /100 | #186 | Fair 65.1% |
| Immigrants | Southern Europe | 34.3 /100 | #187 | Fair 64.9% |
| Immigrants | Albania | 32.0 /100 | #188 | Fair 64.9% |