Navajo vs Immigrants from Iran College, Under 1 year
COMPARE
Navajo
Immigrants from Iran
College, Under 1 year
College, Under 1 year Comparison
Navajo
Immigrants from Iran
56.3%
COLLEGE, UNDER 1 YEAR
0.0/ 100
METRIC RATING
326th/ 347
METRIC RANK
74.3%
COLLEGE, UNDER 1 YEAR
100.0/ 100
METRIC RATING
5th/ 347
METRIC RANK
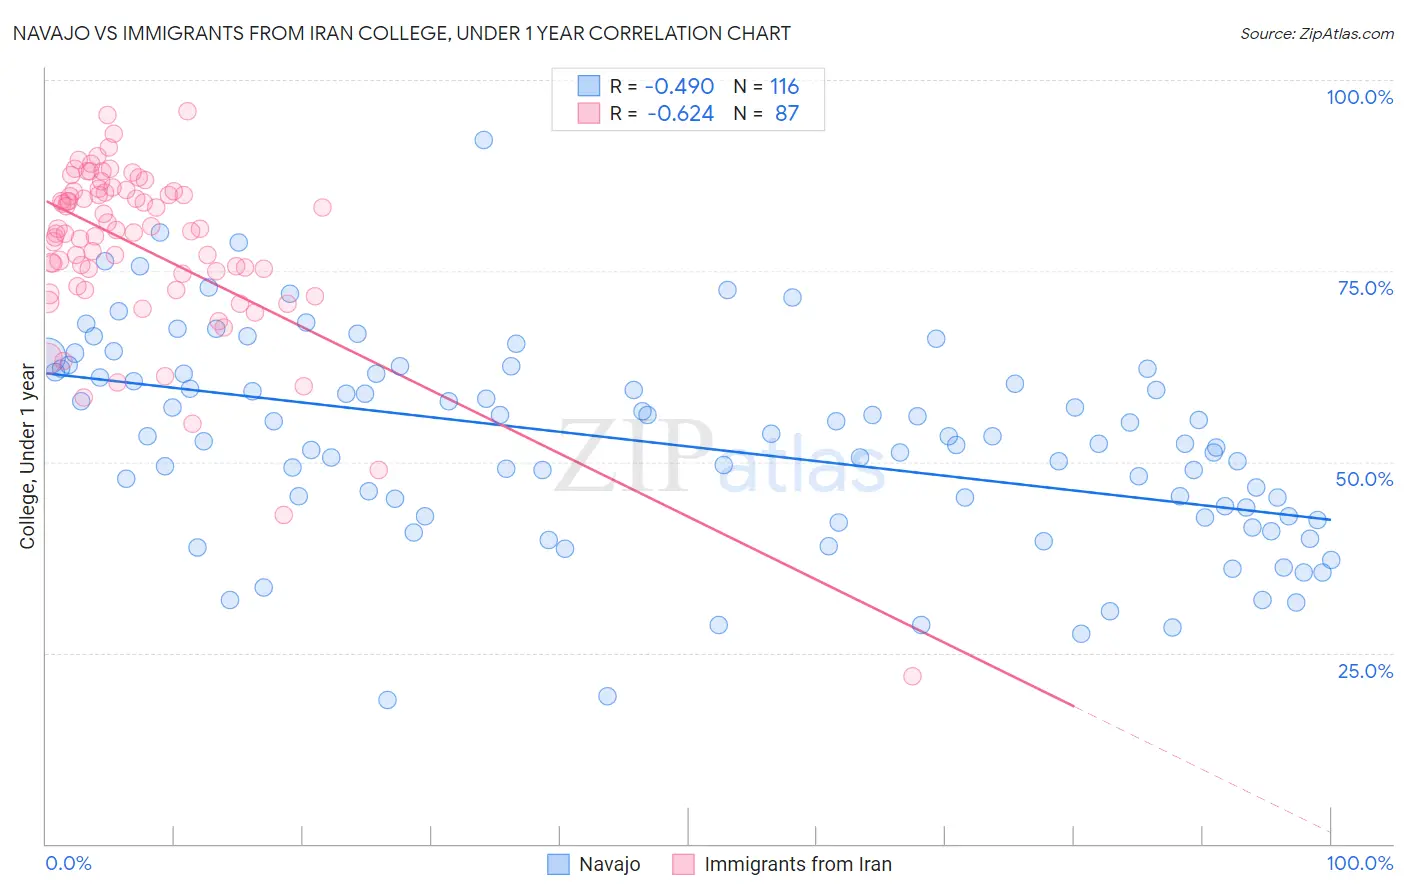
Navajo vs Immigrants from Iran College, Under 1 year Correlation Chart
The statistical analysis conducted on geographies consisting of 224,872,431 people shows a moderate negative correlation between the proportion of Navajo and percentage of population with at least college, under 1 year education in the United States with a correlation coefficient (R) of -0.490 and weighted average of 56.3%. Similarly, the statistical analysis conducted on geographies consisting of 279,905,207 people shows a significant negative correlation between the proportion of Immigrants from Iran and percentage of population with at least college, under 1 year education in the United States with a correlation coefficient (R) of -0.624 and weighted average of 74.3%, a difference of 32.0%.
College, Under 1 year Correlation Summary
| Measurement | Navajo | Immigrants from Iran |
| Minimum | 18.9% | 22.0% |
| Maximum | 92.2% | 96.0% |
| Range | 73.3% | 74.0% |
| Mean | 52.4% | 78.0% |
| Median | 52.5% | 80.1% |
| Interquartile 25% (IQ1) | 42.9% | 73.1% |
| Interquartile 75% (IQ3) | 61.6% | 85.5% |
| Interquartile Range (IQR) | 18.7% | 12.4% |
| Standard Deviation (Sample) | 13.3% | 11.6% |
| Standard Deviation (Population) | 13.2% | 11.5% |
Similar Demographics by College, Under 1 year
Demographics Similar to Navajo by College, Under 1 year
In terms of college, under 1 year, the demographic groups most similar to Navajo are Immigrants from Guatemala (56.2%, a difference of 0.090%), Immigrants from Latin America (56.3%, a difference of 0.15%), Immigrants from El Salvador (56.4%, a difference of 0.25%), Immigrants from Honduras (56.5%, a difference of 0.38%), and Cape Verdean (56.0%, a difference of 0.38%).
| Demographics | Rating | Rank | College, Under 1 year |
| Puerto Ricans | 0.0 /100 | #319 | Tragic 56.8% |
| Guatemalans | 0.0 /100 | #320 | Tragic 56.8% |
| Natives/Alaskans | 0.0 /100 | #321 | Tragic 56.6% |
| Immigrants | Caribbean | 0.0 /100 | #322 | Tragic 56.6% |
| Immigrants | Honduras | 0.0 /100 | #323 | Tragic 56.5% |
| Immigrants | El Salvador | 0.0 /100 | #324 | Tragic 56.4% |
| Immigrants | Latin America | 0.0 /100 | #325 | Tragic 56.3% |
| Navajo | 0.0 /100 | #326 | Tragic 56.3% |
| Immigrants | Guatemala | 0.0 /100 | #327 | Tragic 56.2% |
| Cape Verdeans | 0.0 /100 | #328 | Tragic 56.0% |
| Immigrants | Cuba | 0.0 /100 | #329 | Tragic 55.7% |
| Mexicans | 0.0 /100 | #330 | Tragic 55.6% |
| Dominicans | 0.0 /100 | #331 | Tragic 55.5% |
| Immigrants | Yemen | 0.0 /100 | #332 | Tragic 55.3% |
| Yuman | 0.0 /100 | #333 | Tragic 55.1% |
Demographics Similar to Immigrants from Iran by College, Under 1 year
In terms of college, under 1 year, the demographic groups most similar to Immigrants from Iran are Immigrants from Taiwan (74.2%, a difference of 0.11%), Immigrants from India (74.4%, a difference of 0.23%), Immigrants from Singapore (74.8%, a difference of 0.74%), Iranian (74.9%, a difference of 0.79%), and Okinawan (73.7%, a difference of 0.80%).
| Demographics | Rating | Rank | College, Under 1 year |
| Filipinos | 100.0 /100 | #1 | Exceptional 75.5% |
| Iranians | 100.0 /100 | #2 | Exceptional 74.9% |
| Immigrants | Singapore | 100.0 /100 | #3 | Exceptional 74.8% |
| Immigrants | India | 100.0 /100 | #4 | Exceptional 74.4% |
| Immigrants | Iran | 100.0 /100 | #5 | Exceptional 74.3% |
| Immigrants | Taiwan | 100.0 /100 | #6 | Exceptional 74.2% |
| Okinawans | 100.0 /100 | #7 | Exceptional 73.7% |
| Thais | 100.0 /100 | #8 | Exceptional 73.4% |
| Immigrants | Australia | 100.0 /100 | #9 | Exceptional 72.7% |
| Immigrants | Israel | 100.0 /100 | #10 | Exceptional 72.3% |
| Immigrants | South Central Asia | 100.0 /100 | #11 | Exceptional 72.1% |
| Immigrants | Sweden | 100.0 /100 | #12 | Exceptional 72.1% |
| Cypriots | 100.0 /100 | #13 | Exceptional 72.0% |
| Cambodians | 100.0 /100 | #14 | Exceptional 71.9% |
| Burmese | 100.0 /100 | #15 | Exceptional 71.9% |