Navajo vs Turkish College, Under 1 year
COMPARE
Navajo
Turkish
College, Under 1 year
College, Under 1 year Comparison
Navajo
Turks
56.3%
COLLEGE, UNDER 1 YEAR
0.0/ 100
METRIC RATING
326th/ 347
METRIC RANK
70.7%
COLLEGE, UNDER 1 YEAR
99.9/ 100
METRIC RATING
32nd/ 347
METRIC RANK
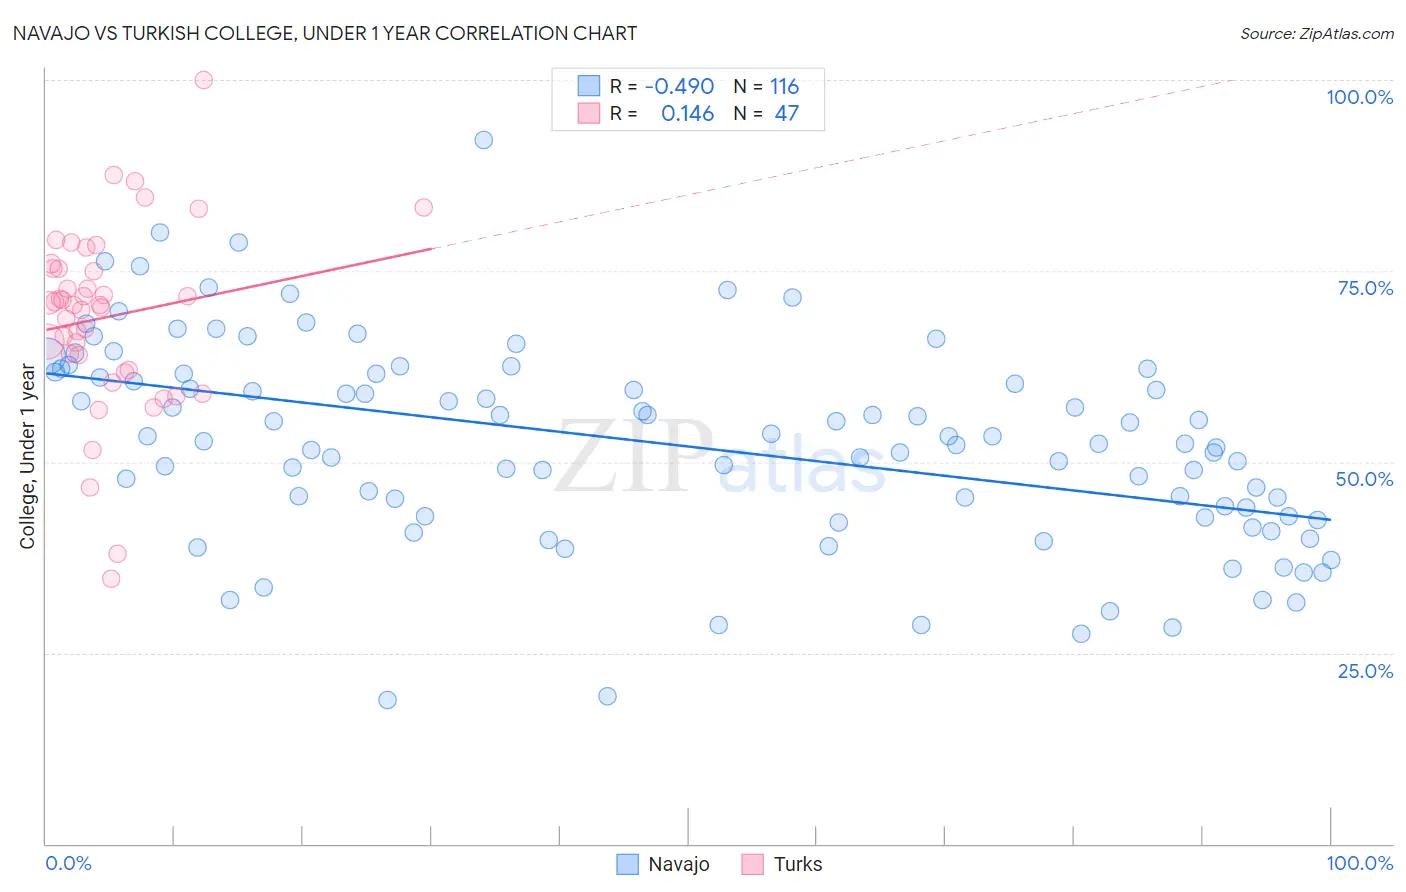
Navajo vs Turkish College, Under 1 year Correlation Chart
The statistical analysis conducted on geographies consisting of 224,872,431 people shows a moderate negative correlation between the proportion of Navajo and percentage of population with at least college, under 1 year education in the United States with a correlation coefficient (R) of -0.490 and weighted average of 56.3%. Similarly, the statistical analysis conducted on geographies consisting of 271,864,133 people shows a poor positive correlation between the proportion of Turks and percentage of population with at least college, under 1 year education in the United States with a correlation coefficient (R) of 0.146 and weighted average of 70.7%, a difference of 25.7%.
College, Under 1 year Correlation Summary
| Measurement | Navajo | Turkish |
| Minimum | 18.9% | 34.7% |
| Maximum | 92.2% | 100.0% |
| Range | 73.3% | 65.3% |
| Mean | 52.4% | 69.0% |
| Median | 52.5% | 70.5% |
| Interquartile 25% (IQ1) | 42.9% | 62.0% |
| Interquartile 75% (IQ3) | 61.6% | 75.3% |
| Interquartile Range (IQR) | 18.7% | 13.3% |
| Standard Deviation (Sample) | 13.3% | 12.1% |
| Standard Deviation (Population) | 13.2% | 11.9% |
Similar Demographics by College, Under 1 year
Demographics Similar to Navajo by College, Under 1 year
In terms of college, under 1 year, the demographic groups most similar to Navajo are Immigrants from Guatemala (56.2%, a difference of 0.090%), Immigrants from Latin America (56.3%, a difference of 0.15%), Immigrants from El Salvador (56.4%, a difference of 0.25%), Immigrants from Honduras (56.5%, a difference of 0.38%), and Cape Verdean (56.0%, a difference of 0.38%).
| Demographics | Rating | Rank | College, Under 1 year |
| Puerto Ricans | 0.0 /100 | #319 | Tragic 56.8% |
| Guatemalans | 0.0 /100 | #320 | Tragic 56.8% |
| Natives/Alaskans | 0.0 /100 | #321 | Tragic 56.6% |
| Immigrants | Caribbean | 0.0 /100 | #322 | Tragic 56.6% |
| Immigrants | Honduras | 0.0 /100 | #323 | Tragic 56.5% |
| Immigrants | El Salvador | 0.0 /100 | #324 | Tragic 56.4% |
| Immigrants | Latin America | 0.0 /100 | #325 | Tragic 56.3% |
| Navajo | 0.0 /100 | #326 | Tragic 56.3% |
| Immigrants | Guatemala | 0.0 /100 | #327 | Tragic 56.2% |
| Cape Verdeans | 0.0 /100 | #328 | Tragic 56.0% |
| Immigrants | Cuba | 0.0 /100 | #329 | Tragic 55.7% |
| Mexicans | 0.0 /100 | #330 | Tragic 55.6% |
| Dominicans | 0.0 /100 | #331 | Tragic 55.5% |
| Immigrants | Yemen | 0.0 /100 | #332 | Tragic 55.3% |
| Yuman | 0.0 /100 | #333 | Tragic 55.1% |
Demographics Similar to Turks by College, Under 1 year
In terms of college, under 1 year, the demographic groups most similar to Turks are Indian (Asian) (70.8%, a difference of 0.080%), Immigrants from South Africa (70.6%, a difference of 0.17%), Estonian (70.6%, a difference of 0.18%), Immigrants from China (70.9%, a difference of 0.19%), and Russian (70.5%, a difference of 0.27%).
| Demographics | Rating | Rank | College, Under 1 year |
| Bulgarians | 100.0 /100 | #25 | Exceptional 71.1% |
| Immigrants | Denmark | 100.0 /100 | #26 | Exceptional 71.0% |
| Immigrants | Ireland | 100.0 /100 | #27 | Exceptional 71.0% |
| Immigrants | Hong Kong | 100.0 /100 | #28 | Exceptional 71.0% |
| Immigrants | France | 100.0 /100 | #29 | Exceptional 71.0% |
| Immigrants | China | 99.9 /100 | #30 | Exceptional 70.9% |
| Indians (Asian) | 99.9 /100 | #31 | Exceptional 70.8% |
| Turks | 99.9 /100 | #32 | Exceptional 70.7% |
| Immigrants | South Africa | 99.9 /100 | #33 | Exceptional 70.6% |
| Estonians | 99.9 /100 | #34 | Exceptional 70.6% |
| Russians | 99.9 /100 | #35 | Exceptional 70.5% |
| Immigrants | Sri Lanka | 99.9 /100 | #36 | Exceptional 70.5% |
| Immigrants | Saudi Arabia | 99.9 /100 | #37 | Exceptional 70.4% |
| Australians | 99.9 /100 | #38 | Exceptional 70.4% |
| Bhutanese | 99.9 /100 | #39 | Exceptional 70.3% |