Native/Alaskan vs Indonesian No Schooling Completed
COMPARE
Native/Alaskan
Indonesian
No Schooling Completed
No Schooling Completed Comparison
Natives/Alaskans
Indonesians
2.2%
NO SCHOOLING COMPLETED
10.0/ 100
METRIC RATING
210th/ 347
METRIC RANK
3.2%
NO SCHOOLING COMPLETED
0.0/ 100
METRIC RATING
326th/ 347
METRIC RANK
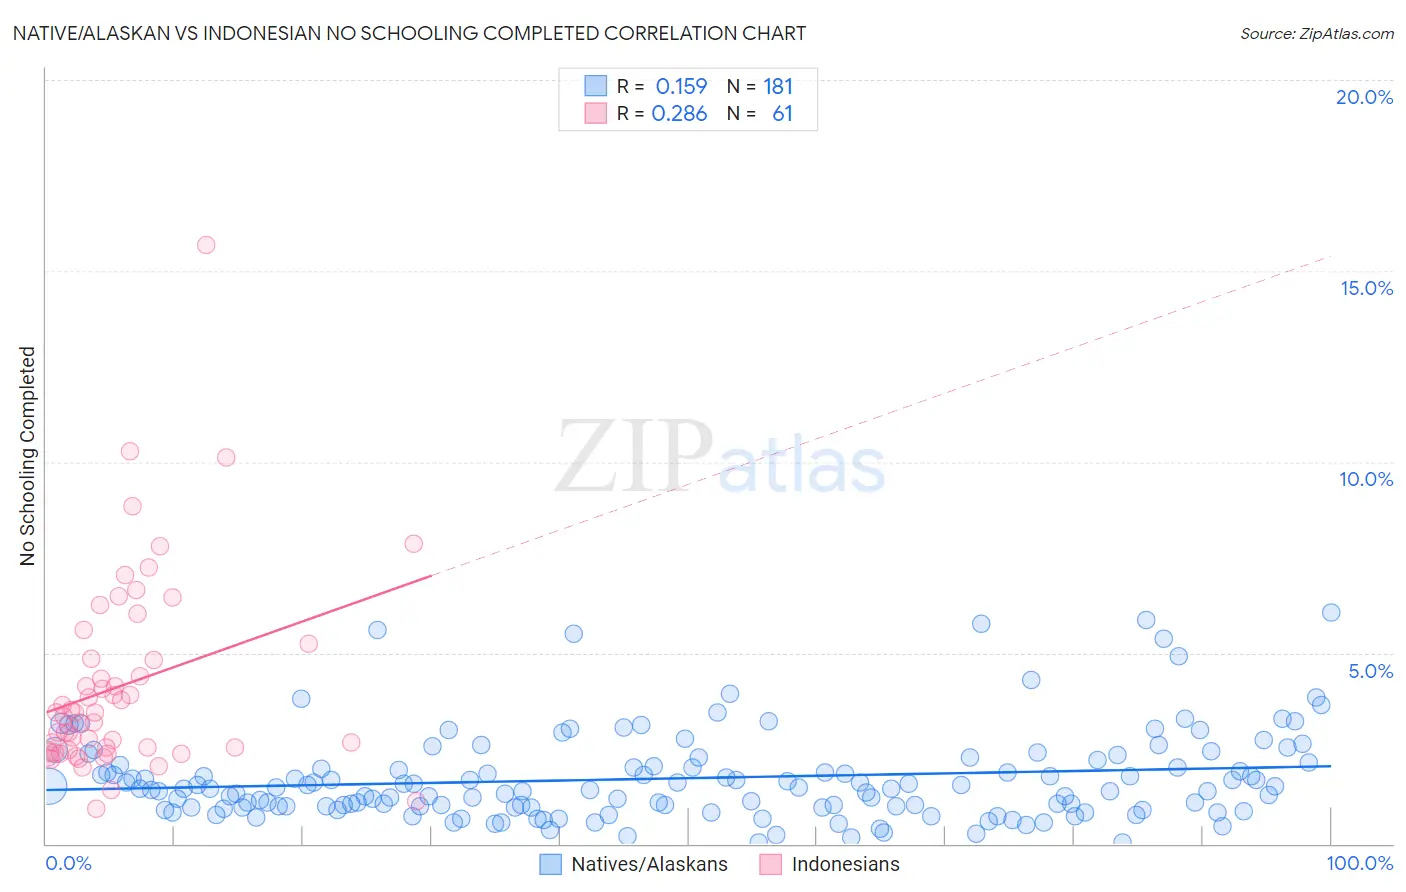
Native/Alaskan vs Indonesian No Schooling Completed Correlation Chart
The statistical analysis conducted on geographies consisting of 503,675,211 people shows a poor positive correlation between the proportion of Natives/Alaskans and percentage of population with no schooling in the United States with a correlation coefficient (R) of 0.159 and weighted average of 2.2%. Similarly, the statistical analysis conducted on geographies consisting of 162,153,140 people shows a weak positive correlation between the proportion of Indonesians and percentage of population with no schooling in the United States with a correlation coefficient (R) of 0.286 and weighted average of 3.2%, a difference of 42.9%.
No Schooling Completed Correlation Summary
| Measurement | Native/Alaskan | Indonesian |
| Minimum | 0.041% | 0.92% |
| Maximum | 6.0% | 15.7% |
| Range | 6.0% | 14.8% |
| Mean | 1.7% | 4.2% |
| Median | 1.4% | 3.4% |
| Interquartile 25% (IQ1) | 0.96% | 2.4% |
| Interquartile 75% (IQ3) | 2.1% | 5.0% |
| Interquartile Range (IQR) | 1.1% | 2.6% |
| Standard Deviation (Sample) | 1.2% | 2.6% |
| Standard Deviation (Population) | 1.2% | 2.6% |
Similar Demographics by No Schooling Completed
Demographics Similar to Natives/Alaskans by No Schooling Completed
In terms of no schooling completed, the demographic groups most similar to Natives/Alaskans are Immigrants from Oceania (2.2%, a difference of 0.070%), South American Indian (2.2%, a difference of 0.33%), Uruguayan (2.2%, a difference of 0.33%), Immigrants from Panama (2.3%, a difference of 0.45%), and Immigrants from Morocco (2.3%, a difference of 0.46%).
| Demographics | Rating | Rank | No Schooling Completed |
| Laotians | 13.3 /100 | #203 | Poor 2.2% |
| Hopi | 12.9 /100 | #204 | Poor 2.2% |
| Immigrants | Bahamas | 11.6 /100 | #205 | Poor 2.2% |
| Bahamians | 11.6 /100 | #206 | Poor 2.2% |
| South American Indians | 11.0 /100 | #207 | Poor 2.2% |
| Uruguayans | 11.0 /100 | #208 | Poor 2.2% |
| Immigrants | Oceania | 10.2 /100 | #209 | Poor 2.2% |
| Natives/Alaskans | 10.0 /100 | #210 | Tragic 2.2% |
| Immigrants | Panama | 8.8 /100 | #211 | Tragic 2.3% |
| Immigrants | Morocco | 8.7 /100 | #212 | Tragic 2.3% |
| Ute | 8.2 /100 | #213 | Tragic 2.3% |
| Samoans | 8.2 /100 | #214 | Tragic 2.3% |
| Immigrants | Zaire | 7.2 /100 | #215 | Tragic 2.3% |
| Tongans | 6.8 /100 | #216 | Tragic 2.3% |
| Immigrants | Syria | 6.6 /100 | #217 | Tragic 2.3% |
Demographics Similar to Indonesians by No Schooling Completed
In terms of no schooling completed, the demographic groups most similar to Indonesians are Dominican (3.2%, a difference of 0.030%), Mexican American Indian (3.2%, a difference of 0.70%), Vietnamese (3.2%, a difference of 1.1%), Immigrants from Honduras (3.2%, a difference of 1.2%), and Immigrants from Laos (3.1%, a difference of 1.9%).
| Demographics | Rating | Rank | No Schooling Completed |
| Immigrants | Burma/Myanmar | 0.0 /100 | #319 | Tragic 3.1% |
| Immigrants | Bangladesh | 0.0 /100 | #320 | Tragic 3.1% |
| Immigrants | Laos | 0.0 /100 | #321 | Tragic 3.1% |
| Immigrants | Honduras | 0.0 /100 | #322 | Tragic 3.2% |
| Vietnamese | 0.0 /100 | #323 | Tragic 3.2% |
| Mexican American Indians | 0.0 /100 | #324 | Tragic 3.2% |
| Dominicans | 0.0 /100 | #325 | Tragic 3.2% |
| Indonesians | 0.0 /100 | #326 | Tragic 3.2% |
| Immigrants | Latin America | 0.0 /100 | #327 | Tragic 3.3% |
| Mexicans | 0.0 /100 | #328 | Tragic 3.3% |
| Immigrants | Vietnam | 0.0 /100 | #329 | Tragic 3.3% |
| Immigrants | Armenia | 0.0 /100 | #330 | Tragic 3.3% |
| Japanese | 0.0 /100 | #331 | Tragic 3.3% |
| Central Americans | 0.0 /100 | #332 | Tragic 3.4% |
| Immigrants | Dominican Republic | 0.0 /100 | #333 | Tragic 3.4% |