Native/Alaskan vs Immigrants from Turkey No Schooling Completed
COMPARE
Native/Alaskan
Immigrants from Turkey
No Schooling Completed
No Schooling Completed Comparison
Natives/Alaskans
Immigrants from Turkey
2.2%
NO SCHOOLING COMPLETED
10.0/ 100
METRIC RATING
210th/ 347
METRIC RANK
1.9%
NO SCHOOLING COMPLETED
90.2/ 100
METRIC RATING
133rd/ 347
METRIC RANK
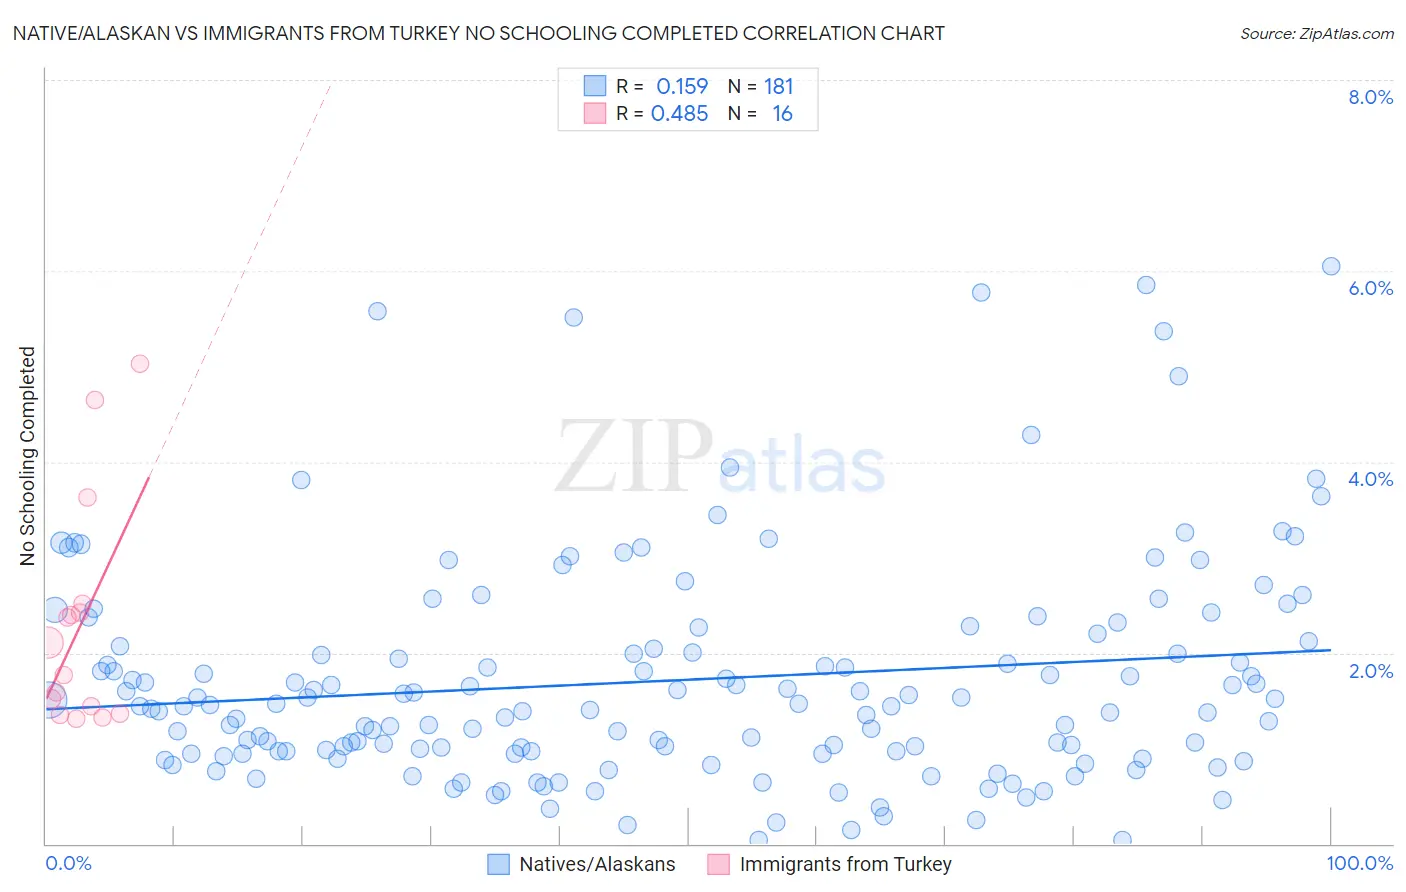
Native/Alaskan vs Immigrants from Turkey No Schooling Completed Correlation Chart
The statistical analysis conducted on geographies consisting of 503,675,211 people shows a poor positive correlation between the proportion of Natives/Alaskans and percentage of population with no schooling in the United States with a correlation coefficient (R) of 0.159 and weighted average of 2.2%. Similarly, the statistical analysis conducted on geographies consisting of 221,912,605 people shows a moderate positive correlation between the proportion of Immigrants from Turkey and percentage of population with no schooling in the United States with a correlation coefficient (R) of 0.485 and weighted average of 1.9%, a difference of 16.0%.
No Schooling Completed Correlation Summary
| Measurement | Native/Alaskan | Immigrants from Turkey |
| Minimum | 0.041% | 1.3% |
| Maximum | 6.0% | 5.0% |
| Range | 6.0% | 3.7% |
| Mean | 1.7% | 2.3% |
| Median | 1.4% | 1.9% |
| Interquartile 25% (IQ1) | 0.96% | 1.4% |
| Interquartile 75% (IQ3) | 2.1% | 2.5% |
| Interquartile Range (IQR) | 1.1% | 1.1% |
| Standard Deviation (Sample) | 1.2% | 1.2% |
| Standard Deviation (Population) | 1.2% | 1.1% |
Similar Demographics by No Schooling Completed
Demographics Similar to Natives/Alaskans by No Schooling Completed
In terms of no schooling completed, the demographic groups most similar to Natives/Alaskans are Immigrants from Oceania (2.2%, a difference of 0.070%), South American Indian (2.2%, a difference of 0.33%), Uruguayan (2.2%, a difference of 0.33%), Immigrants from Panama (2.3%, a difference of 0.45%), and Immigrants from Morocco (2.3%, a difference of 0.46%).
| Demographics | Rating | Rank | No Schooling Completed |
| Laotians | 13.3 /100 | #203 | Poor 2.2% |
| Hopi | 12.9 /100 | #204 | Poor 2.2% |
| Immigrants | Bahamas | 11.6 /100 | #205 | Poor 2.2% |
| Bahamians | 11.6 /100 | #206 | Poor 2.2% |
| South American Indians | 11.0 /100 | #207 | Poor 2.2% |
| Uruguayans | 11.0 /100 | #208 | Poor 2.2% |
| Immigrants | Oceania | 10.2 /100 | #209 | Poor 2.2% |
| Natives/Alaskans | 10.0 /100 | #210 | Tragic 2.2% |
| Immigrants | Panama | 8.8 /100 | #211 | Tragic 2.3% |
| Immigrants | Morocco | 8.7 /100 | #212 | Tragic 2.3% |
| Ute | 8.2 /100 | #213 | Tragic 2.3% |
| Samoans | 8.2 /100 | #214 | Tragic 2.3% |
| Immigrants | Zaire | 7.2 /100 | #215 | Tragic 2.3% |
| Tongans | 6.8 /100 | #216 | Tragic 2.3% |
| Immigrants | Syria | 6.6 /100 | #217 | Tragic 2.3% |
Demographics Similar to Immigrants from Turkey by No Schooling Completed
In terms of no schooling completed, the demographic groups most similar to Immigrants from Turkey are Colville (1.9%, a difference of 0.10%), Menominee (1.9%, a difference of 0.25%), Immigrants from Hungary (1.9%, a difference of 0.60%), Hmong (1.9%, a difference of 0.65%), and Palestinian (1.9%, a difference of 0.71%).
| Demographics | Rating | Rank | No Schooling Completed |
| Immigrants | Romania | 92.6 /100 | #126 | Exceptional 1.9% |
| Israelis | 92.4 /100 | #127 | Exceptional 1.9% |
| Spaniards | 92.3 /100 | #128 | Exceptional 1.9% |
| Seminole | 92.0 /100 | #129 | Exceptional 1.9% |
| Palestinians | 91.8 /100 | #130 | Exceptional 1.9% |
| Immigrants | Hungary | 91.6 /100 | #131 | Exceptional 1.9% |
| Colville | 90.4 /100 | #132 | Exceptional 1.9% |
| Immigrants | Turkey | 90.2 /100 | #133 | Exceptional 1.9% |
| Menominee | 89.6 /100 | #134 | Excellent 1.9% |
| Hmong | 88.5 /100 | #135 | Excellent 1.9% |
| Burmese | 88.2 /100 | #136 | Excellent 1.9% |
| Filipinos | 85.5 /100 | #137 | Excellent 2.0% |
| Immigrants | Israel | 85.4 /100 | #138 | Excellent 2.0% |
| Jordanians | 84.5 /100 | #139 | Excellent 2.0% |
| Marshallese | 83.5 /100 | #140 | Excellent 2.0% |