Immigrants from Hungary vs Nigerian 12th Grade, No Diploma
COMPARE
Immigrants from Hungary
Nigerian
12th Grade, No Diploma
12th Grade, No Diploma Comparison
Immigrants from Hungary
Nigerians
92.1%
12TH GRADE, NO DIPLOMA
97.0/ 100
METRIC RATING
109th/ 347
METRIC RANK
90.3%
12TH GRADE, NO DIPLOMA
4.5/ 100
METRIC RATING
227th/ 347
METRIC RANK
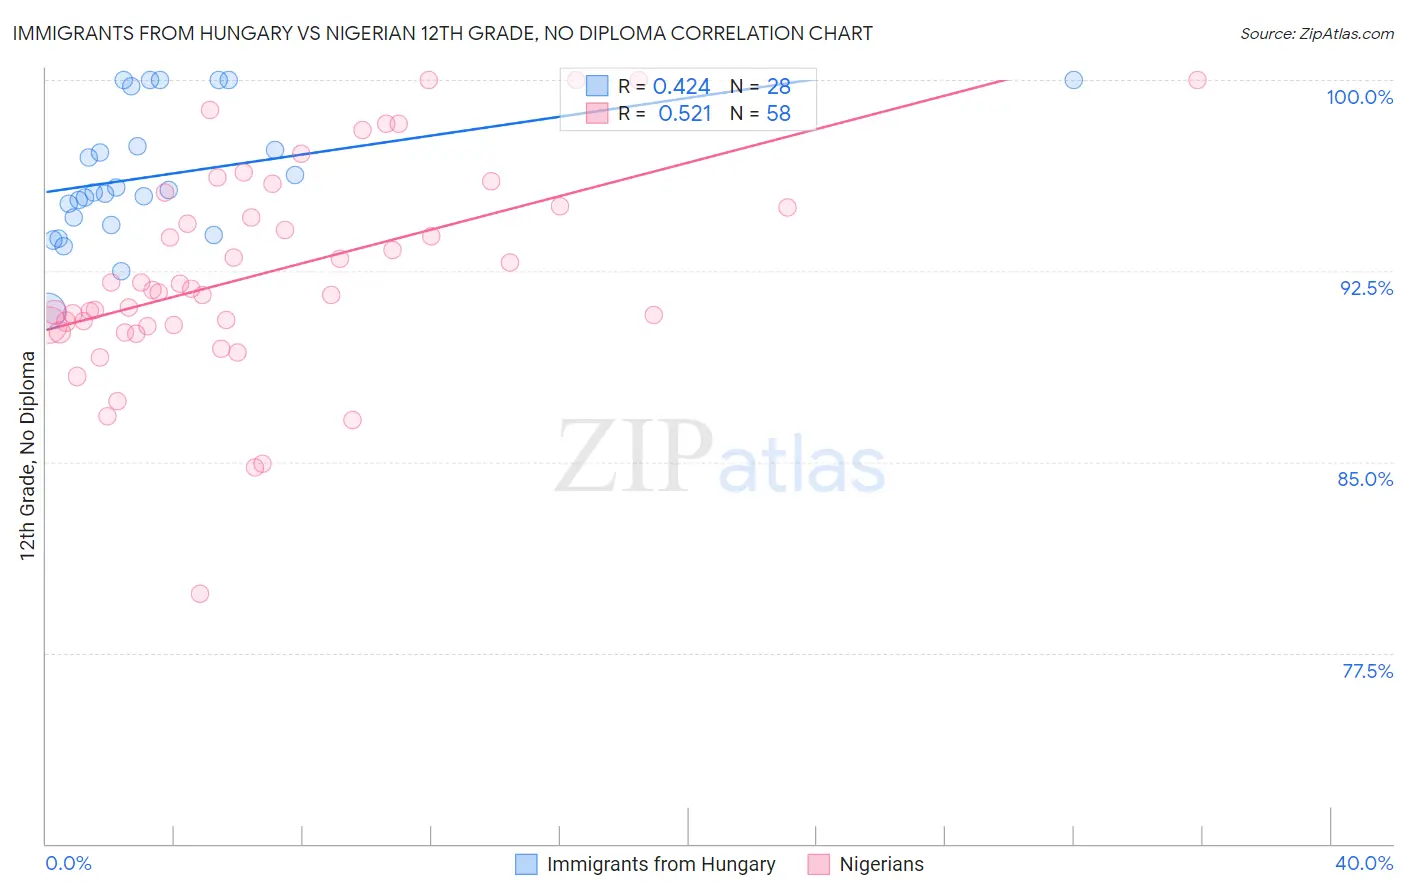
Immigrants from Hungary vs Nigerian 12th Grade, No Diploma Correlation Chart
The statistical analysis conducted on geographies consisting of 195,707,305 people shows a moderate positive correlation between the proportion of Immigrants from Hungary and percentage of population with at least 12th grade (no diploma) education in the United States with a correlation coefficient (R) of 0.424 and weighted average of 92.1%. Similarly, the statistical analysis conducted on geographies consisting of 332,724,627 people shows a substantial positive correlation between the proportion of Nigerians and percentage of population with at least 12th grade (no diploma) education in the United States with a correlation coefficient (R) of 0.521 and weighted average of 90.3%, a difference of 2.0%.
12th Grade, No Diploma Correlation Summary
| Measurement | Immigrants from Hungary | Nigerian |
| Minimum | 90.9% | 79.8% |
| Maximum | 100.0% | 100.0% |
| Range | 9.1% | 20.2% |
| Mean | 96.3% | 92.5% |
| Median | 95.6% | 91.8% |
| Interquartile 25% (IQ1) | 94.5% | 90.4% |
| Interquartile 75% (IQ3) | 98.6% | 95.0% |
| Interquartile Range (IQR) | 4.1% | 4.7% |
| Standard Deviation (Sample) | 2.6% | 4.1% |
| Standard Deviation (Population) | 2.5% | 4.1% |
Similar Demographics by 12th Grade, No Diploma
Demographics Similar to Immigrants from Hungary by 12th Grade, No Diploma
In terms of 12th grade, no diploma, the demographic groups most similar to Immigrants from Hungary are Palestinian (92.1%, a difference of 0.0%), Immigrants from Greece (92.1%, a difference of 0.010%), Syrian (92.2%, a difference of 0.020%), Jordanian (92.2%, a difference of 0.020%), and Israeli (92.1%, a difference of 0.020%).
| Demographics | Rating | Rank | 12th Grade, No Diploma |
| Alaskan Athabascans | 98.1 /100 | #102 | Exceptional 92.3% |
| Immigrants | Norway | 98.1 /100 | #103 | Exceptional 92.3% |
| Lebanese | 97.6 /100 | #104 | Exceptional 92.2% |
| Immigrants | Belarus | 97.4 /100 | #105 | Exceptional 92.2% |
| Immigrants | Russia | 97.3 /100 | #106 | Exceptional 92.2% |
| Syrians | 97.2 /100 | #107 | Exceptional 92.2% |
| Jordanians | 97.2 /100 | #108 | Exceptional 92.2% |
| Immigrants | Hungary | 97.0 /100 | #109 | Exceptional 92.1% |
| Palestinians | 97.0 /100 | #110 | Exceptional 92.1% |
| Immigrants | Greece | 96.9 /100 | #111 | Exceptional 92.1% |
| Israelis | 96.8 /100 | #112 | Exceptional 92.1% |
| Immigrants | Zimbabwe | 96.5 /100 | #113 | Exceptional 92.1% |
| Yugoslavians | 96.5 /100 | #114 | Exceptional 92.1% |
| Immigrants | Sri Lanka | 96.4 /100 | #115 | Exceptional 92.1% |
| Aleuts | 96.3 /100 | #116 | Exceptional 92.1% |
Demographics Similar to Nigerians by 12th Grade, No Diploma
In terms of 12th grade, no diploma, the demographic groups most similar to Nigerians are Immigrants from Zaire (90.3%, a difference of 0.010%), Immigrants from Panama (90.3%, a difference of 0.020%), Chickasaw (90.3%, a difference of 0.020%), South American (90.3%, a difference of 0.030%), and Immigrants from Somalia (90.4%, a difference of 0.050%).
| Demographics | Rating | Rank | 12th Grade, No Diploma |
| Colombians | 6.6 /100 | #220 | Tragic 90.4% |
| Immigrants | Liberia | 5.7 /100 | #221 | Tragic 90.4% |
| Immigrants | Somalia | 5.3 /100 | #222 | Tragic 90.4% |
| South Americans | 5.0 /100 | #223 | Tragic 90.3% |
| Immigrants | Panama | 4.8 /100 | #224 | Tragic 90.3% |
| Chickasaw | 4.8 /100 | #225 | Tragic 90.3% |
| Immigrants | Zaire | 4.6 /100 | #226 | Tragic 90.3% |
| Nigerians | 4.5 /100 | #227 | Tragic 90.3% |
| Creek | 3.9 /100 | #228 | Tragic 90.3% |
| Immigrants | Bahamas | 3.6 /100 | #229 | Tragic 90.2% |
| Immigrants | Philippines | 2.8 /100 | #230 | Tragic 90.2% |
| Peruvians | 2.7 /100 | #231 | Tragic 90.2% |
| Blackfeet | 2.4 /100 | #232 | Tragic 90.1% |
| Immigrants | Thailand | 2.3 /100 | #233 | Tragic 90.1% |
| Immigrants | South America | 2.3 /100 | #234 | Tragic 90.1% |