Samoan vs Nigerian 12th Grade, No Diploma
COMPARE
Samoan
Nigerian
12th Grade, No Diploma
12th Grade, No Diploma Comparison
Samoans
Nigerians
90.8%
12TH GRADE, NO DIPLOMA
20.4/ 100
METRIC RATING
198th/ 347
METRIC RANK
90.3%
12TH GRADE, NO DIPLOMA
4.5/ 100
METRIC RATING
227th/ 347
METRIC RANK
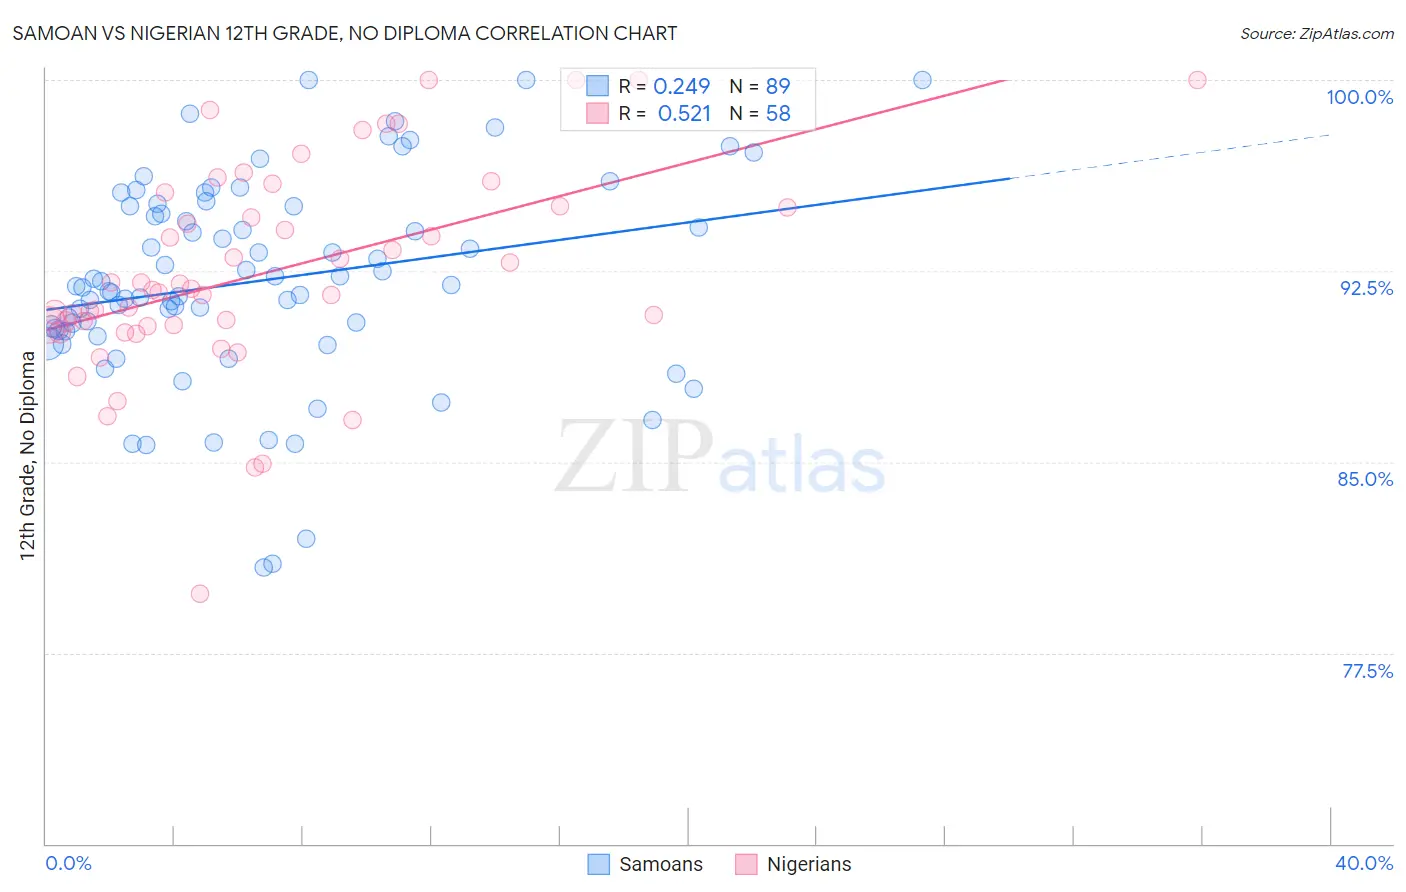
Samoan vs Nigerian 12th Grade, No Diploma Correlation Chart
The statistical analysis conducted on geographies consisting of 225,206,099 people shows a weak positive correlation between the proportion of Samoans and percentage of population with at least 12th grade (no diploma) education in the United States with a correlation coefficient (R) of 0.249 and weighted average of 90.8%. Similarly, the statistical analysis conducted on geographies consisting of 332,724,627 people shows a substantial positive correlation between the proportion of Nigerians and percentage of population with at least 12th grade (no diploma) education in the United States with a correlation coefficient (R) of 0.521 and weighted average of 90.3%, a difference of 0.52%.
12th Grade, No Diploma Correlation Summary
| Measurement | Samoan | Nigerian |
| Minimum | 80.8% | 79.8% |
| Maximum | 100.0% | 100.0% |
| Range | 19.2% | 20.2% |
| Mean | 92.1% | 92.5% |
| Median | 91.9% | 91.8% |
| Interquartile 25% (IQ1) | 90.2% | 90.4% |
| Interquartile 75% (IQ3) | 95.0% | 95.0% |
| Interquartile Range (IQR) | 4.9% | 4.7% |
| Standard Deviation (Sample) | 4.0% | 4.1% |
| Standard Deviation (Population) | 4.0% | 4.1% |
Similar Demographics by 12th Grade, No Diploma
Demographics Similar to Samoans by 12th Grade, No Diploma
In terms of 12th grade, no diploma, the demographic groups most similar to Samoans are Immigrants from Southern Europe (90.8%, a difference of 0.010%), Liberian (90.8%, a difference of 0.010%), Hawaiian (90.8%, a difference of 0.010%), Panamanian (90.8%, a difference of 0.040%), and Immigrants from Sudan (90.8%, a difference of 0.040%).
| Demographics | Rating | Rank | 12th Grade, No Diploma |
| Moroccans | 28.8 /100 | #191 | Fair 90.9% |
| Immigrants | Eastern Africa | 27.7 /100 | #192 | Fair 90.9% |
| Immigrants | Ethiopia | 27.2 /100 | #193 | Fair 90.9% |
| Immigrants | Oceania | 26.0 /100 | #194 | Fair 90.9% |
| Koreans | 24.5 /100 | #195 | Fair 90.8% |
| Panamanians | 22.8 /100 | #196 | Fair 90.8% |
| Immigrants | Sudan | 22.6 /100 | #197 | Fair 90.8% |
| Samoans | 20.4 /100 | #198 | Fair 90.8% |
| Immigrants | Southern Europe | 19.9 /100 | #199 | Poor 90.8% |
| Liberians | 19.8 /100 | #200 | Poor 90.8% |
| Hawaiians | 19.7 /100 | #201 | Poor 90.8% |
| Marshallese | 18.2 /100 | #202 | Poor 90.7% |
| Tongans | 16.1 /100 | #203 | Poor 90.7% |
| French American Indians | 15.5 /100 | #204 | Poor 90.7% |
| Immigrants | Sierra Leone | 14.9 /100 | #205 | Poor 90.7% |
Demographics Similar to Nigerians by 12th Grade, No Diploma
In terms of 12th grade, no diploma, the demographic groups most similar to Nigerians are Immigrants from Zaire (90.3%, a difference of 0.010%), Immigrants from Panama (90.3%, a difference of 0.020%), Chickasaw (90.3%, a difference of 0.020%), South American (90.3%, a difference of 0.030%), and Immigrants from Somalia (90.4%, a difference of 0.050%).
| Demographics | Rating | Rank | 12th Grade, No Diploma |
| Colombians | 6.6 /100 | #220 | Tragic 90.4% |
| Immigrants | Liberia | 5.7 /100 | #221 | Tragic 90.4% |
| Immigrants | Somalia | 5.3 /100 | #222 | Tragic 90.4% |
| South Americans | 5.0 /100 | #223 | Tragic 90.3% |
| Immigrants | Panama | 4.8 /100 | #224 | Tragic 90.3% |
| Chickasaw | 4.8 /100 | #225 | Tragic 90.3% |
| Immigrants | Zaire | 4.6 /100 | #226 | Tragic 90.3% |
| Nigerians | 4.5 /100 | #227 | Tragic 90.3% |
| Creek | 3.9 /100 | #228 | Tragic 90.3% |
| Immigrants | Bahamas | 3.6 /100 | #229 | Tragic 90.2% |
| Immigrants | Philippines | 2.8 /100 | #230 | Tragic 90.2% |
| Peruvians | 2.7 /100 | #231 | Tragic 90.2% |
| Blackfeet | 2.4 /100 | #232 | Tragic 90.1% |
| Immigrants | Thailand | 2.3 /100 | #233 | Tragic 90.1% |
| Immigrants | South America | 2.3 /100 | #234 | Tragic 90.1% |